

 Download PDF
SHC298 TI1
Document overview
- PDF pages: 9
Technical content
Page 1
© 1977 Burr-Brown Corporation
PDS-373E
Printed in U.S.A. August, 1996
SBFS011
Page 2
SPECIFICATIONS
ELECTRICAL
At TJ = +25°C, ±15V supplies, 1000pF holding capacitor, –11.5V ≤ VIN ≤ +11.5, RL = 10kΩ, Logic Reference Voltage = 0V, and Logic Voltage = 2.5 V, unless otherwise noted.
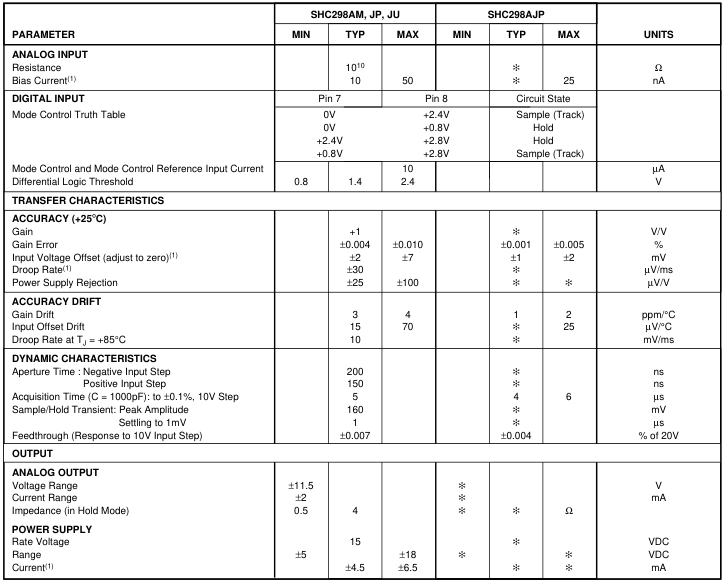
6 Same as specifications for SHC298AM, JP, JU. NOTES: (1) These parameters guaranteed over a supply voltage range of ±5V to = ±18V. (2) Charge offset is sensitive to stray capacitive coupling between input logic signals and the hold capacitor. 1pF, for instance, will create an additional 0.5mV step with a 5V logic swing and a 0.01µF hold capacitor. Magnitude of the charge offset is inversely proportional to hold capacitor value.
Page 3
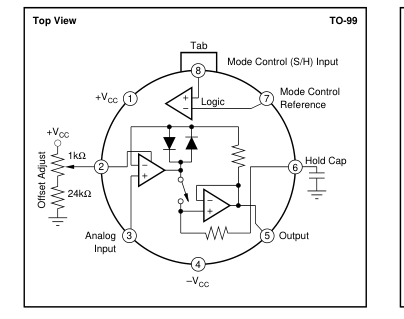
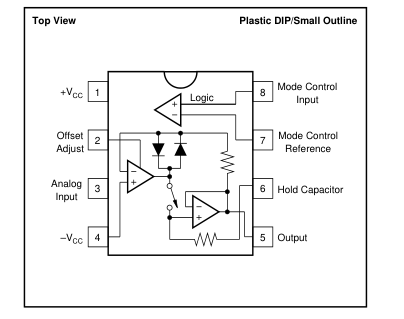
PIN CONFIGURATIONS
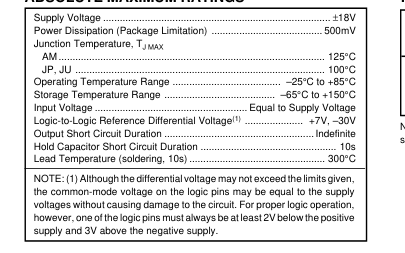
ABSOLUTE MAXIMUM RATINGS
PACKAGE/ORDERING INFORMATION
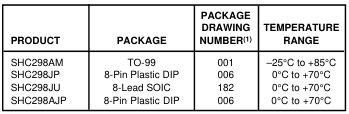
NOTE: (1) For detailed drawing and dimension table, please see end of data sheet, or Appendix C of Burr-Brown IC Data Book.
The information provided herein is believed to be reliable; however, BURR-BROWN assumes no responsibility for inaccuracies or omissions. BURR-BROWN assumes no responsibility for the use of this information, and all use of such information shall be entirely at the user’s own risk. Prices and specifications are subject to change without notice. No patent rights or licenses to any of the circuits described herein are implied or granted to any third party. BURR-BROWN does not authorize or warrant any BURR-BROWN product for use in life support devices and/or systems.
Page 4
TYPICAL PERFORMANCE CURVES
At TJ = +25°C, ±15V supplies, 1000pF holding capacitor, –11.5V ≤ VIN ≤ +11.5, RL = 10kΩ, Logic Reference Voltage = 0V, and Logic Voltage = 2.5 V, unless otherwise noted.
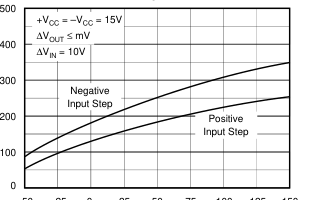
APERTURE TIME
–50 –25 0 25 50 75 100 125 150
Junction Temperature (°C)
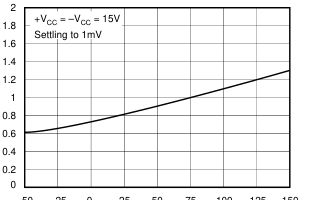
SAMPLE-TO-HOLD TRANSIENT SETTLING TIME
–50 –25 0 25 50 75 100 125 150
Junction Temperature (°C)
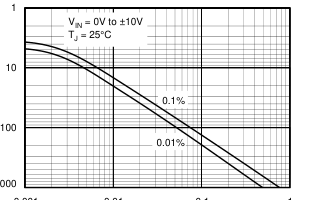
ACQUISITION TIME
0.001
0.01
0.1
1
Hold Capacitor (µF)
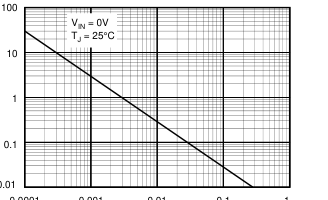
CHARGE OFFSET
0.0001 0.001 0.01 0.1 1
Hold Capacitor (µF)
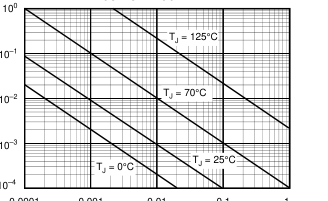
OUTPUT DROOP RATE
0.0001 0.001 0.01 0.1 1
Hold Capacitor (µF)
OUTPUT NOISE
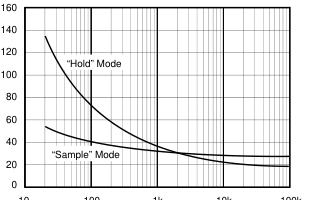
10 100 1k 10k 100k
Frequency (Hz)
Page 5
TYPICAL PERFORMANCE CURVES (CONT)
At TJ = +25°C, ±15V supplies, 1000pF holding capacitor, –11.5V ≤ VIN ≤ +11.5, RL = 10kΩ, Logic Reference Voltage = 0V, and Logic Voltage = 2.5 V, unless otherwise noted.
DYNAMIC SAMPLING ERROR
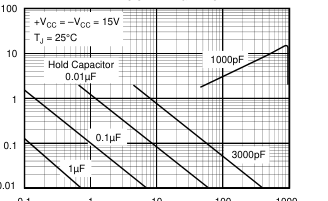
0.1 1 10 100 1000
Input Slew Rate (V/ms)
CHARGE OFFSET
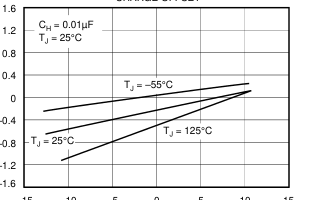
–5 0 5
–15 –10
10 15
Input Voltage (V)
INPUT BIAS CURRENT
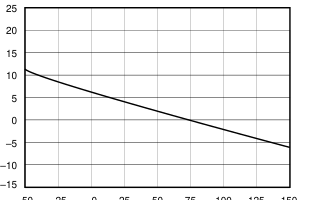
–50 –25 –0
25 50 75 100 125 150
Junction Temperature (°C)
GAIN ERROR
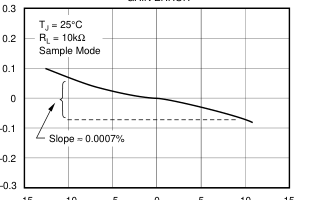
–5 0 5
–15 –10
10 15
Output Voltage (V)
POWER SUPPLY REJECTION
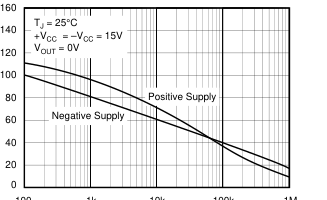
100 1k 10k 100k 1M
Frequency (Hz)
FEEDTHROUGH REJECTION RATIO
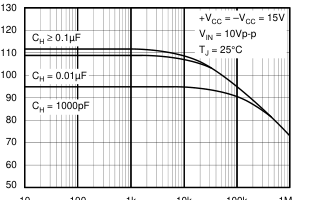
10 100 1k 10k 100k 1M
Frequency (Hz)
Page 6
TYPICAL PERFORMANCE CURVES (CONT)
At TJ = +25°C, ±15V supplies, 1000pF holding capacitor, –11.5V ≤ VIN ≤ +11.5, RL = 10kΩ, Logic Reference Voltage = 0V, and Logic Voltage = 2.5 V, unless otherwise noted.
PHASE AND GAIN (Input to Output, Small Signal)
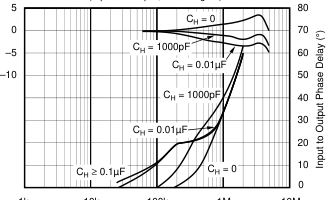
1k 10k 100k 1M 10M
Frequency (Hz)
DISCUSSION OF
SPECIFICATIONS
THROUGHPUT NONLINEARITY
Throughput nonlinearity is defined as total Hold mode, nonadjustable, input to output error caused by charge offset, gain nonlinearity, 1ms of droop, feedthrough, and thermal transients. It is the inaccuracy due to these errors which cannot be corrected by offset and gain adjustments. Throughput nonlinearity is tested with a 1000pF holding capacitor, 10V input changes, 10µs acquisition time, and 1ms Hold time (see Figure 1).
GAIN ACCURACY
Gain Accuracy is the difference between input and output voltage (when in the Sample mode) due to amplifier gain errors.
DROOP RATE
Droop Rate is the voltage decay at the output when in the Hold mode due to storage capacitor, FET switch leakage currents, and output amplifier bias current.
FEEDTHROUGH
Feedthrough is the amount of the input voltage change that appears at the output when the amplifier is in the Hold mode.
APERTURE TIME
Aperture Time is the time required to switch from Sample to Hold. The time is measured from the 50% point of the mode control transition to the time at which the output stops tracking the input.
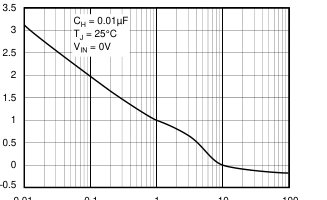
CHARGE OFFSET
0.01 0.1 1 10 100
Logic Slew Rate (V/µs)
ACQUISITION TIME
Acquisition Time is the time required for the sample/hold output to settle within a given error band of its final value when the mode control is switched from Hold to Sample.
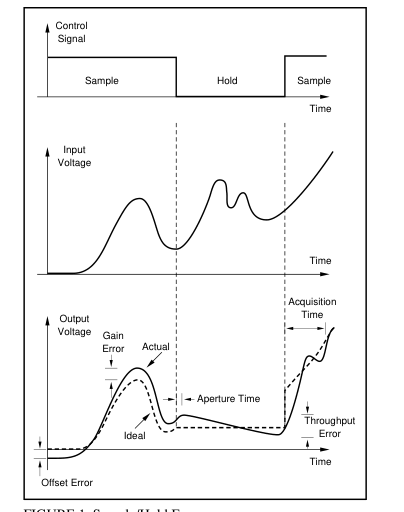
FIGURE 1. Sample/Hold Errors.
Page 7
CHARGE OFFSET
Charge Offset is the offset that results from the charge coupled through the gate capacitance of the switching FET. This charge is coupled into the storage capacitor when the FET is switched to the “hold” mode.
OPERATING INSTRUCTIONS
EXTERNAL CAPACITOR SELECTION
Capacitors with high insulation resistance and low dielectric absorption, such as Teflon®, polystyrene or polypropylene units, should be used as storage elements (polystyrene should not be used above +85°C). Care should be taken in the printed circuit layout to minimize AC and DC leakage currents from the capacitor to reduce charge offset and droop errors. The value of the external capacitor determines the droop, charge offset and acquisition time of the Sample/Hold. Both droop and charge offset will vary linearly with capacitance from the values given in the specification table for a 0.001µF capacitor. With a capacitor of 0.01µF, the droop will reduce to approximately 2.5µV/ms and the charge offset to approxi-
mately 1.5mV. The behavior of acquisition time with changes in external capacitance is shown in the Typical Performance Curves.
OFFSET ADJUSTMENT
The offset should be adjusted with the input grounded. During the adjustment, the sample/hold should be switching continuously between the Sample and the Hold mode. The error should then be adjusted to zero when the unit is in the Hold mode. In this way, charge offset as well as amplifier offset will be adjusted. When a 0.001µF capacitor is used, it will not be possible to adjust the full offset error at the sample/hold. It should be adjusted elsewhere in the system.
APPLICATIONS
DATA ACQUISITION
The SHC298 may be used to hold data for conversion with an analog-to-digital converter or used to provide Pulse Amplitude Modulation (PAM) data output (see Figures 2 and 3).
DATA DISTRIBUTION
The SHC298 may be used to hold the output of a digital-to- analog converter whose digital inputs are multiplexed (see Figure 4).
TEST SYSTEMS
The SHC298 is also well suited for use in test systems to acquire and hold data transients for human operators or for the other parts of the test system such as comparators, digital voltmeters, etc.
®Teflon, DuPont de Nemours
With a 0.1µF storage capacitor, the output may be held 10 seconds with less than 0.1% error. With a 1µF storage capacitor, the output may be held more than 15 minutes with less than 1% error.
CAPACITIVE LOADING
SHC298 is sensitive to capacitive loading on the output and may oscillate. When driving long lines, a buffer should be used.
HIGH SPEED DATA ACQUISITION
The minimum sample time for one channel in a data acquisition system is usually considered to be the acquisition time of the sample/hold plus the conversion time of the analog-to- digital converter. If two or more sample/holds are used with a high-speed multiplexer, the acquisition time of the sample/ hold can be virtually eliminated. While the first channel is in hold and switched on to the ADC, the multiplexer may be addressed to the next channel. The second sample/hold will have acquired this data by the time the conversion is complete. Then, the sample/holds reverse roles and another channel is addressed (see Figure 5). For low-level systems, and instrumentation amplifier and double-ended multiplexer
may be connected to the sample/hold inputs. The settling time of the multiplexer, instrumentation amplifier, and sample/hold can be eliminated from the channel conversion time as before.
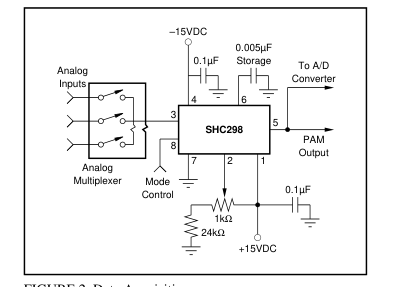
FIGURE 2. Data Acquisition.
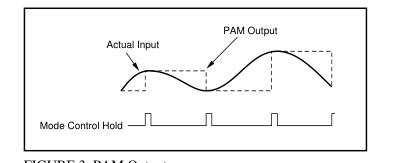
FIGURE 3. PAM Output.
Page 8
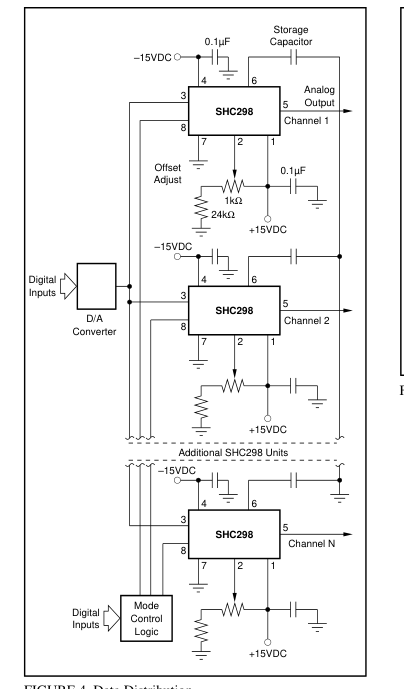
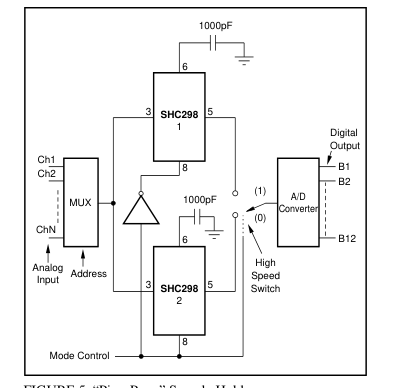
FIGURE 5. “Ping-Pong” Sample Holds.
FIGURE 4. Data Distribution.
Page 9
IMPORTANT NOTICE
Texas Instruments and its subsidiaries (TI) reserve the right to make changes to their products or to discontinue any product or service without notice, and advise customers to obtain the latest version of relevant information to verify, before placing orders, that information being relied on is current and complete. All products are sold subject to the terms and conditions of sale supplied at the time of order acknowledgment, including those pertaining to warranty, patent infringement, and limitation of liability.
TI warrants performance of its semiconductor products to the specifications applicable at the time of sale in accordance with TI’s standard warranty. Testing and other quality control techniques are utilized to the extent TI deems necessary to support this warranty. Specific testing of all parameters of each device is not necessarily performed, except those mandated by government requirements.
Customers are responsible for their applications using TI components.
In order to minimize risks associated with the customer’s applications, adequate design and operating safeguards must be provided by the customer to minimize inherent or procedural hazards.
TI assumes no liability for applications assistance or customer product design. TI does not warrant or represent that any license, either express or implied, is granted under any patent right, copyright, mask work right, or other intellectual property right of TI covering or relating to any combination, machine, or process in which such semiconductor products or services might be or are used. TI’s publication of information regarding any third party’s products or services does not constitute TI’s approval, warranty or endorsement thereof.
Copyright 2000, Texas Instruments Incorporated