
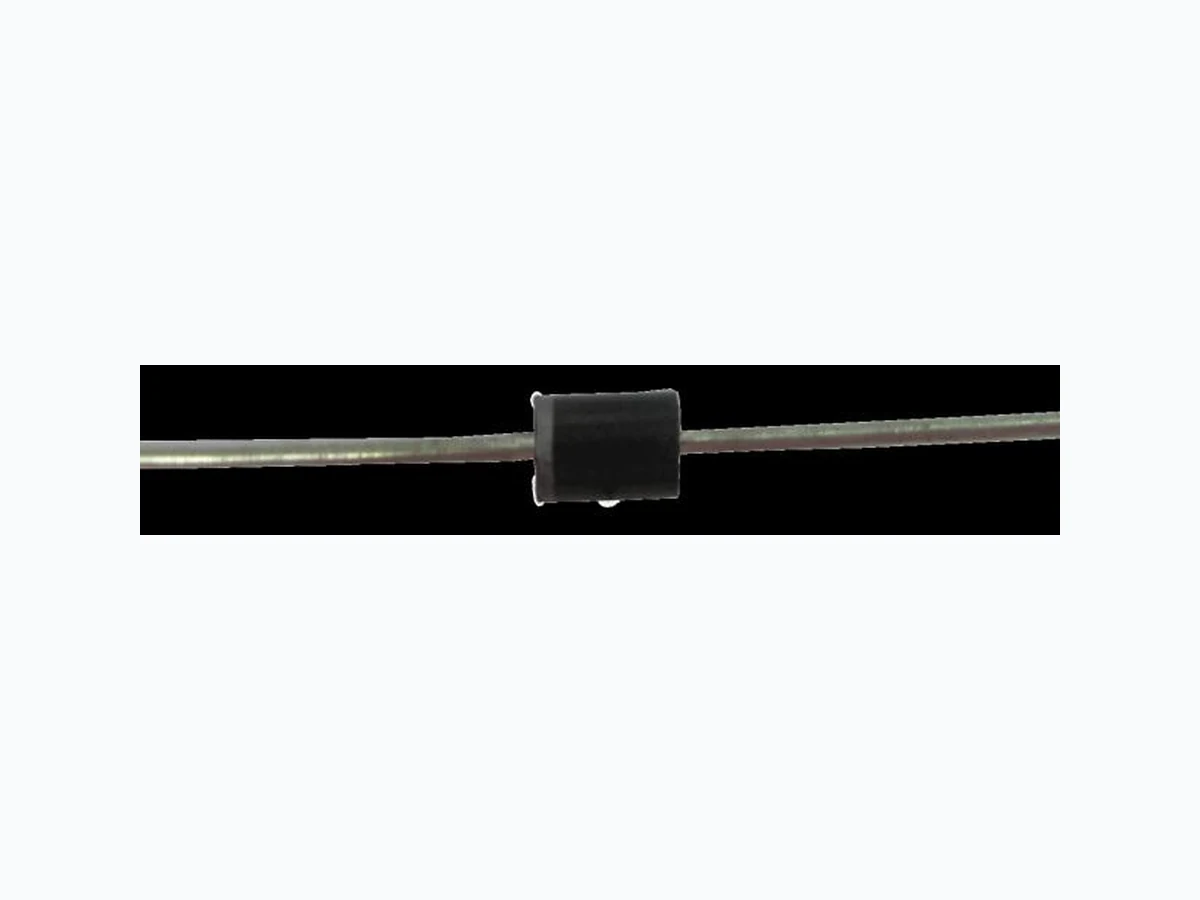
RT100KP33A ETC2
Document overview
- Manufacturer or author: Provided By www.digicamel.com(FREE DATASHEET DOWNLOAD SITE)
- PDF pages: 3
Technical content
Features
Breakdown Voltages (VBR) from 33 to 400V 100KW peak pulse power capability with a 6.4/69μs waveform, repetitive rate (duty cycle):0.005% Fast Response Time Low incremental surge resistance Excellent clamping capability Available in uni-directional and bi-directional High temperature soldering guaranteed: 265℃ /10 seconds, 0.375” (9.5mm) lead length, 5lbs. (2.3kg) tension Application Use in sensitive electronics protection against voltage transients induced by inductive load switching and lighting on ICS, MOSFE, signal lines of sensor units for consumer, computer, industrial, automotive and telecommunication Mechanical Data Case: Void-free transfer molded thermosetting epoxy body meeting UL94V-O Terminals: Tin-Lead or ROHS Compliant annealed matte-Tin plating readily solderable per MIL-STD-750, Method 2026 Marking: Body marked with part number Polarity: Band denotes cathode. Bidirectional not marked. Weight: 2.1g(Approximately) CASE: R-6 Dimensions in inches and (millimeters) 打印无效
RT100KP33A thru RT100KP400CA Document Number: RT100KP33A thru RT100KP400CA www.smsemi.com Feb.29, 2012 2 Note1. For bidirectional construction, indicate a CA suffix (instead of A) after the part number, i.e. RT100KP400CA. Note2. Clamping voltage does not include any variable parasitic lead inductance effects observed during the 6.4µs rise time due to lead length. Note3. The Maximum Peak Pulse Current (IPP) shown represents the performance capabilities by design. Part Number (Note1 ) Breakdown Voltage VBR @ IBR Rated Stand Off Voltage Maximum Reverse Leakage ID @ VWM Maximum Peak Pulse Current (Note3) @6.4/69µs Maximum Clamping Voltage VC @ IPP(Note2) Maximum Temperature Coefficient of V(BR) MIN MAX VBR(V) IBR(mA) VWM(V) ID(µA) IPP (A) VC(V) α v(BR)(mV/℃) RT100KP33A RT100KP36A RT100KP40A RT100KP43A 36.7 40.0 44.4 47.8 40.6 44.2 49.1 52.8 33.0 36.0 40.0 43.0 5000 5000 1500 500 1825 1672 1518 1432 58.6 61.8 68.6 71.0 RT100KP45A RT100KP48A RT100KP51A RT100KP54A 50.0 53.3 56.7 60.0 55.3 58.9 62.7 66.3 45.0 48.0 51.0 54.0 150 150 1365 1285 1205 1139 73.0 77.7 82.8 87.5 RT100KP58A RT100KP60A RT100KP64A RT100KP70A 64.4 66.7 71.1 77.8 71.2 73.7 78.6 86.0 58.0 60.0 67.0 70.0 1066 1012 959 879 94.0 97.3 104.0 114.0 RT100KP75A RT100KP78A RT100KP85A RT100KP90A 83.3 86.7 94.4 100.0 92.1 95.8 104.0 111.0 75.0 78.0 85.0 95.0 819 793 726 686 122.0 126.0 137.0 146.0 102 109 RT100KP100A RT100KP110A RT100KP120A RT100KP130A 111.0 122.0 133.0 144.0 123.0 135.0 147.0 159.0 100.0 110.0 120.0 130.0 619 559 519 473 162.0 178.0 193.0 209.0 121 133 145 157 RT100KP150A RT100KP160A RT100KP170A RT100KP180A 167.0 178.0 189.0 200.0 185.0 197.0 209.0 221.0 150.0 160.0 170.0 180.0 413 386 366 346 243.0 259.0 275.0 291.0 183 195 207 219 RT100KP200A RT100KP220A RT100KP250A RT100KP260A 222.0 245.0 278.0 289.0 245.0 271.0 308.0 320.0 200.0 220.0 250.0 260.0 313 280 246 236 322.0 356.0 403.0 419.0 243 269 306 318 RT100KP280A RT100KP300A RT100KP350A RT100KP400A 311.0 333.0 389.0 444.0 345.0 369.0 431.0 492.0 280.0 300.0 350.0 400.0 220 206 176 153 451.0 483.0 564.0 644.0 344 368 430 490 打印无效
RT100KP33A thru RT100KP400CA Document Number: RT100KP33A thru RT100KP400CA www.smsemi.com Feb.29, 2012 3 Characteristic Curve Fig.2 Derating Curve PPP - Peak Pulse Power (kW) 103 102 1.0 0.1 1.0 10 102 103 tw-Pulse Width (µs) 100 PPP-Peak Pulse Power or continuous Average Power in Percent of 25 ℃ (%) Peak Pulse Power (Single pulse). Average Power 0 50 100 150 200 Lead or Ambient Temperature (℃) Fig. 1 Peak Pulse Power vs. Pulse Time To 50% of Exponentially Decaying Pulse 打印无效