

 Download PDF
Digitally Controlled Programmable-Gain Instrumentation Amp datasheet
Document overview
- PDF pages: 13
Technical content
Page 1
SBOS002
Page 2
SPECIFICATIONS
ELECTRICAL
At +25°C, VCC = ±15V unless otherwise noted.
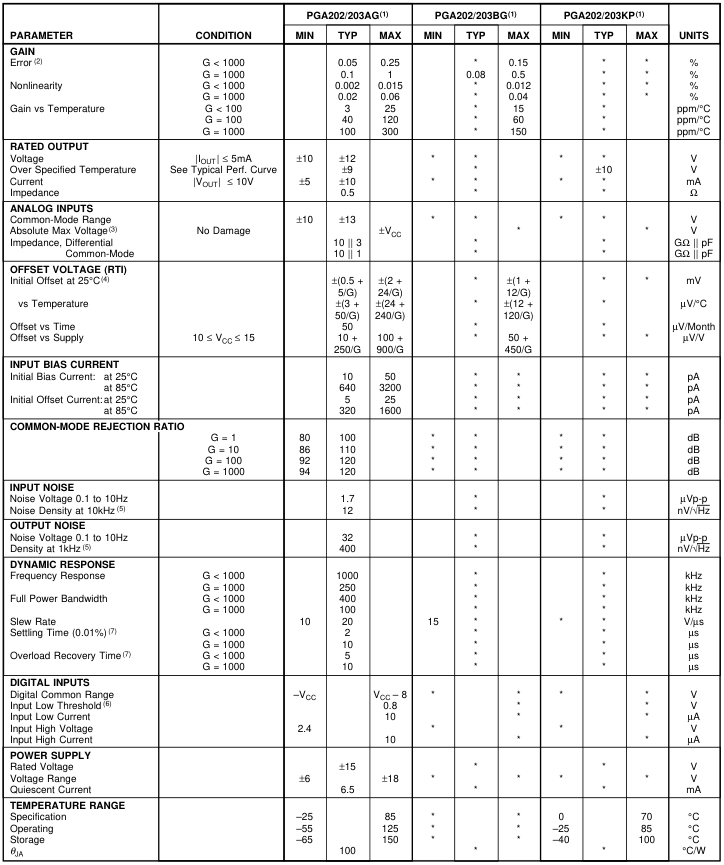
\* Same as the PGA202/203AG NOTES: (1) All specifications apply to both the PGA202 and the PGA203. Values given for a gain of 10 are the same for a gain of 8 and other values may be interpolated. (2) Measured with a 10k load. (3) The analog inputs are internally diode clamped. (4) Adjustable to zero. (5) VNOISE (RTI) = √(VN INPUT)2 + (VN OUTPUT/Gain)2. (6) Threshold voltages are referenced to Digital Common. (7) From input change or gain change.
Page 3
PIN CONFIGURATION
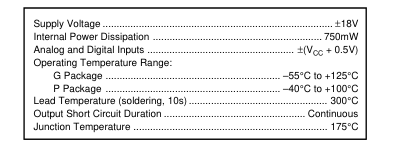
ABSOLUTE MAXIMUM RATINGS
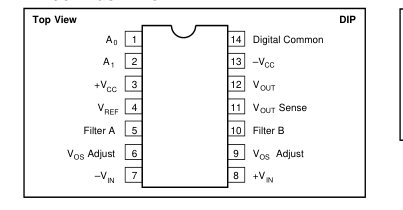
PACKAGE INFORMATION
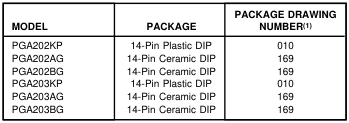
NOTE: (1) For detailed drawing and dimension table, please see end of data sheet, or Appendix D of Burr-Brown IC Data Book.
ORDERING INFORMATION
| MODEL | GAINS | PACKAGE | TEMPERATURE RANGE | OFFSET VOLTAGE MAX (mV) | |||
|---|---|---|---|---|---|---|---|
| PGA202KP PGA202AG PGA202BG | 1, 10, 100, 1000 1, 10, 100, 1000 1, 10, 100, 1000 | Plastic DIP Ceramic DIP Ceramic DIP | 0°C to +70°C –25°C to +85°C –25°C to +85°C | ±(2 + 24/G) ±(2 + 24/G) ±(1 + 12/G) | |||
| PGA203KP PGA203AG PGA203BG | 1, 2, 4, 8 1, 2, 4, 8 1, 2, 4, 8 | Plastic DIP Ceramic DIP Ceramic DIP | 0°C to +70°C –25°C to +85°C –25°C to +85°C | ±(2 + 24/G) ±(2 + 24/G) ±(1 + 12/G) | |||
The information provided herein is believed to be reliable; however, BURR-BROWN assumes no responsibility for inaccuracies or omissions. BURR-BROWN assumes no responsibility for the use of this information, and all use of such information shall be entirely at the user’s own risk. Prices and specifications are subject to change without notice. No patent rights or licenses to any of the circuits described herein are implied or granted to any third party. BURR-BROWN does not authorize or warrant any BURR-BROWN product for use in life support devices and/or systems.
Page 4
TYPICAL PERFORMANCE CURVES
TA = +25°C, VS = ±15V unless otherwise noted.
GAIN vs FREQUENCY
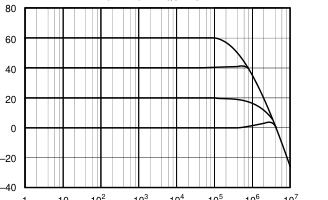
10 10 10 10 10
1 10 10 Frequency (Hz)
CMRR vs FREQUENCY
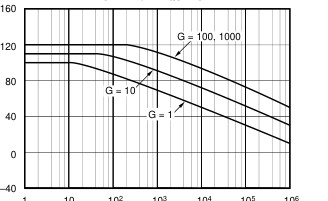
102 103
106
1 10
10 10
Frequency (Hz)
INPUT NOISE vs FREQUENCY
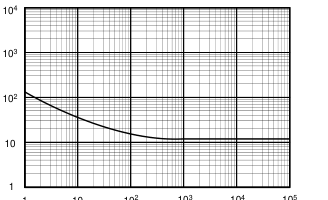
102 103 10 10
1 10 Frequency (Hz)
GAIN ERROR vs FREQUENCY
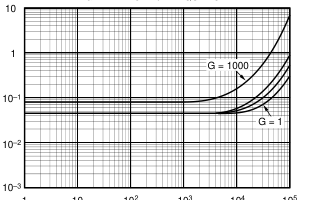
102 103 10 10
1 10 Frequency (Hz)
PSRR vs FREQUENCY
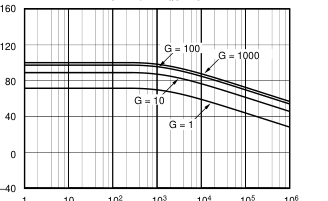
102 103
106
1 10
10 10
Frequency (Hz)
OUTPUT NOISE vs FREQUENCY
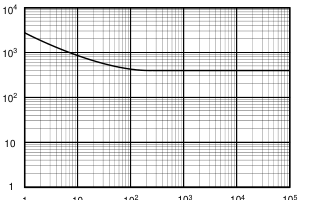
102 103 10 10
1 10 Frequency (Hz)
Page 5
TYPICAL PERFORMANCE CURVES (CONT)
TA = +25°C, VS = ±15V unless otherwise noted.
QUIESCENT CURRENT vs POWER SUPPLY
INPUT BIAS CURRENT vs POWER SUPPLY
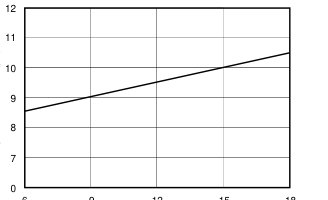
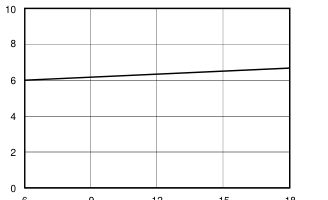
6 9 12 15 18
6
Power Supply (±V)
INPUT RANGE vs POWER SUPPLY
9 12 15 18
Power Supply (±V)
OUTPUT SWING vs POWER SUPPLY
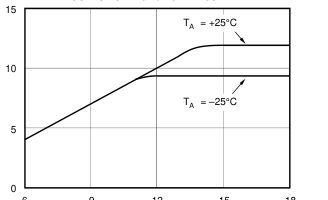
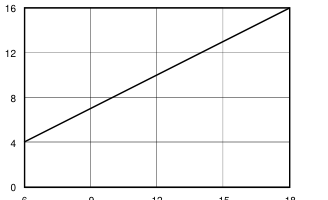
6
6 9 12 15 18
Power Supply (±V)
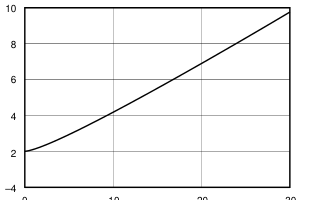
OUTPUT SWING vs LOAD
9 12 15 18
Power Supply (±V)
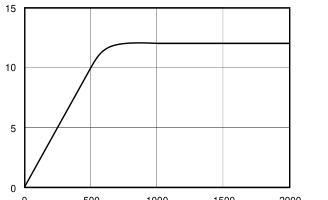
SETTLING TIME vs FILTER CAPACITOR
0 500 1000 1500 2000
0
10
20
30
Load ( )
Filter Capacitor (pF)
Ω
Page 6
TYPICAL PERFORMANCE CURVES (CONT)
TA = +25°C, VS = ±15V unless otherwise noted.
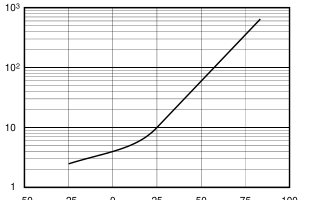
QUIESCENT CURRENT vs TEMPERATURE
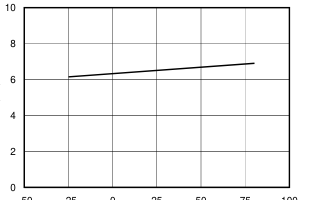
INPUT BIAS CURRENT vs TEMPERATURE
–50
–50 –25 0 25 50 75 100
Temperature (°C)
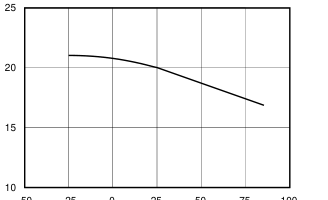
CURRENT LIMIT vs TEMPERATURE
–25 0 25 50 75 100
Temperature (°C)
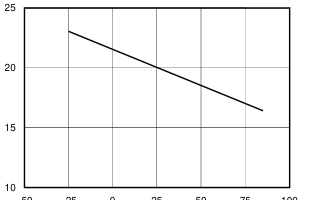
SLEW RATE vs TEMPERATURE
–50
–50 –25 0 25 50 75 100
Temperature (°C)
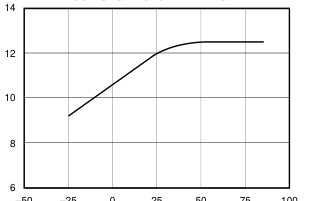
OUTPUT SWING vs TEMPERATURE
–50 –25 0 25 50 75 100
Temperature (°C)
–25 0 25 50 75 100
Temperature (°C)
LARGE SIGNAL RESPONSE
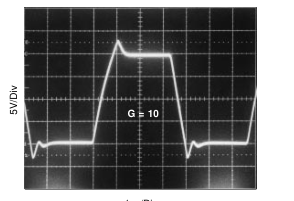
1µs/Div
Page 7
TYPICAL PERFORMANCE
CURVES (CONT)
TA = +25°C, VCC = ±15V unless otherwise noted.
SMALL SIGNAL RESPONSE
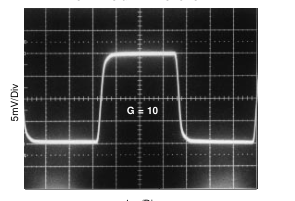
1µs/Div
DISCUSSION OF
PERFORMANCE
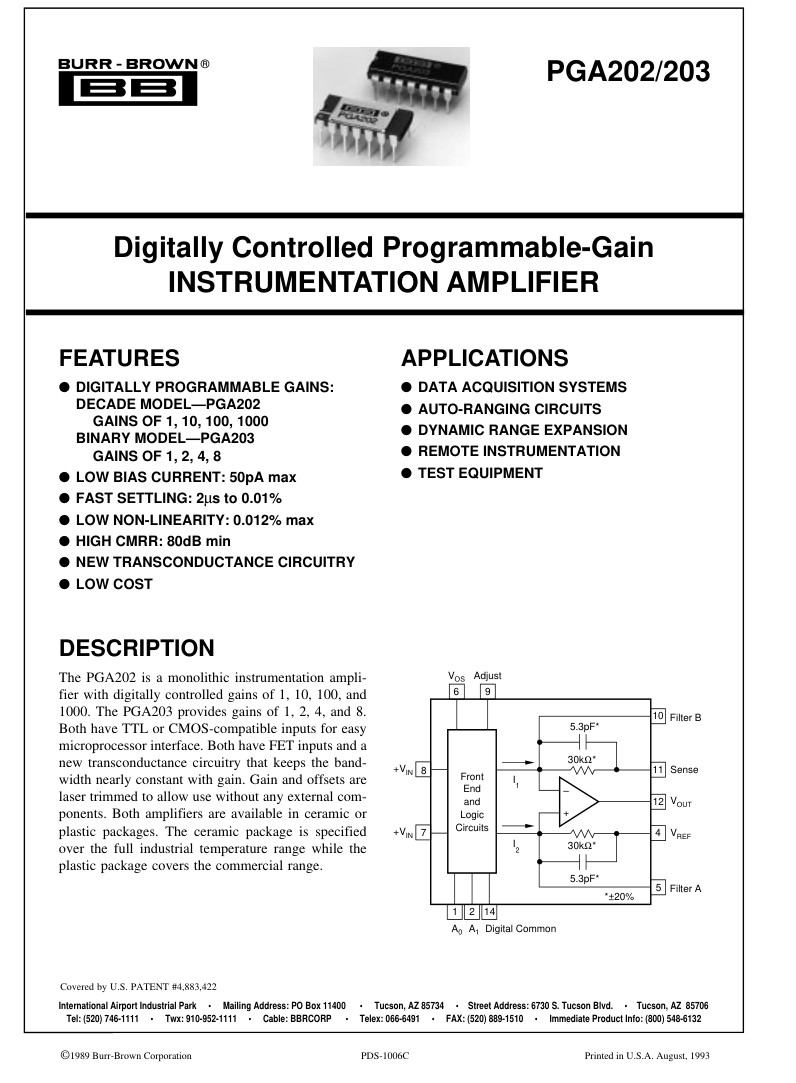
A simplified diagram of the PGA202/203 is shown on the first page. The design consists of a digitally controlled, differential transconductance front end stage using precision FET buffers and the classical transimpedance output stage. Gain switching is accomplished with a novel current steering technique that allows for fast settling when changing gains. The result is a high performance, programmable instrumentation amplifier with excellent speed and gain accuracy. The input stage uses a new circuit topology that includes FET buffers to give extremely low input bias currents. The differential input voltage is converted into a differential output current with the transconductance gain selected by
steering the input stage bias current between four identical input stages differing only in the value of the gain setting resistor. Each input stage is individually laser-trimmed for input offset, offset drift, and gain. The output stage is a differential transimpedance amplifier. Unlike the classical difference amplifier output stage, the common-mode rejection is not limited by the resistor matching. However, the output resistors are laser-trimmed to help minimize the output offset and drift.
BASIC CONNECTIONS
Figure 1 shows the proper connections for power supply and signal. The power supplies should be decoupled with 1µF tantalum capacitors placed as close to the amplifier as possible for maximum performance. To avoid gain and CMR errors introduced by the external components, you should connect the grounds as indicated. Any resistance in the sense line (pin 11) or the VREF line (pin 4) will lead to a gain error, so these lines should be kept as short as possible. To also maintain stability, avoid capacitance from the output to the input or the offset adjust pins.
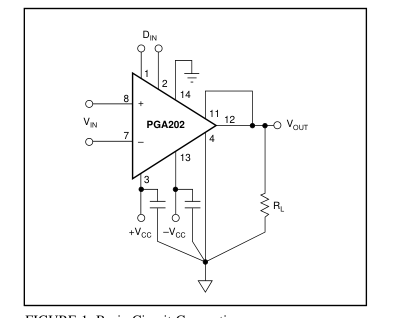
FIGURE 1. Basic Circuit Connections.
OFFSET ADJUSTMENT
Figure 2 shows the offset adjustment circuits for the PGA202/ 203. The input offset and the output offset are both separately adjustable. Notice that because the PGA202/203 change between four different input stages to change gain, the input offset voltage will change slightly with gain. For systems using computer autozeroing techniques, neither offset nor drift is a major concern, but it should be noted that since the input offset does change with gain, these systems should perform an autozero cycle after each gain change for optimum performance. In the output offset adjustment circuit, the choice of the buffering op amp is very important. The op amp needs to
have low output impedance and a wide bandwidth to maintain full accuracy over the entire frequency range of the PGA202/203. For these reasons we recommend the OPA602 as an excellent choice for this application.
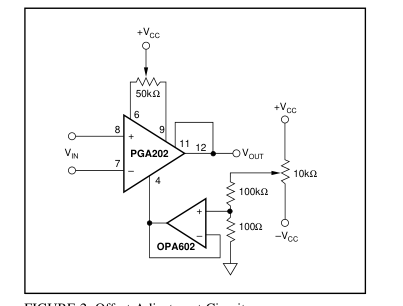
FIGURE 2. Offset Adjustment Circuits.
Page 8
GAIN SELECTION
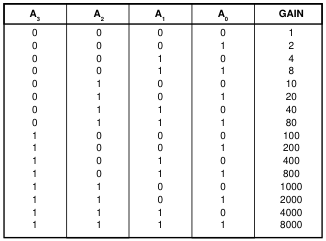
Gain selection is accomplished by the application of a 2-bit digital word to the gain select inputs. Table I shows the gains for the different possible values of the digital input word. The logic inputs are referred to their own separate digital common pin, which can be connected to any voltage be- tween the minus supply and 8V below the positive supply. The gains are all internally trimmed to an initial accuracy of better than 0.1%, so no external gain adjustment is required. However, if necessary the gains can be increased by the use of an external attenuator around the output stage as shown in Figure 3. Recommended resistor values for certain selected
output gains are given in Table II.
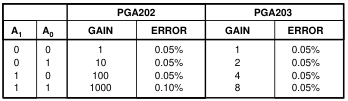
TABLE I. Software Gain Selection.

TABLE II. Output Stage Gain Control.
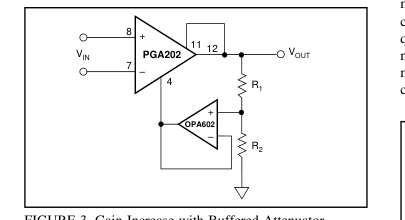
FIGURE 3. Gain Increase with Buffered Attenuator.
COMMON-MODE INPUT RANGE
Unlike the classical three op amp type of circuit, the input common-mode range of the PGA202/203 does not depend on the differential input and the gain. In the standard three op amp circuit, the input common-mode signal must be kept below the maximum output voltage of the input amplifier minus 1/2 the final output voltage. If, for example, these amplifiers can swing ±12V, then to get 12V at the output you must restrict the input common-mode voltage to only 6V. The circuitry of the PGA202/203 is such that the commonmode input range applies to either input pin regardless of the output voltage.
OUTPUT SENSE
An output sense has been provided to allow greater accuracy in connecting the load. By attaching this feedback point to the load at the load site, IR drops due to the load currents are eliminated since they are inside the feedback loop. Proper connection is shown in Figure 1. When more current is required, a power booster can be placed in the feedback loop as shown in Figure 4. Buffer errors are minimized by the loop gain of the output amplifier.
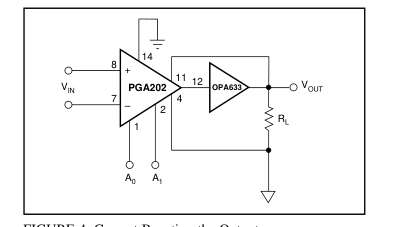
FIGURE 4. Current Boosting the Output.
OUTPUT FILTERING
The summing nodes of the output amplifier have also been made available to allow for output filtering. By placing matched capacitors in parallel with the existing internal capacitors as shown in Figure 5, you can lower the frequency response of the output amplifier. This will reduce the noise of the amplifier, at the cost of a slower response. The nominal frequency responses for some selected values of capacitor are shown in Table III.
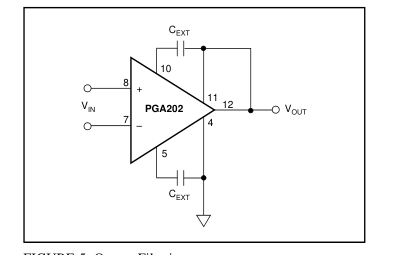
FIGURE 5. Output Filtering.
| CUTOFF FREQUENCY | C AND C 1 2 |
| 1MHz 100kHz 10kHz | None 47pF 525pF |
TABLE III. Output Frequency vs Filter Capacitors.
Page 9
INPUT CHARACTERISTICS
Because the PGA202/203 have FET inputs, the bias currents drawn through input source resistors have a negligible effect on DC accuracy. The picoamp currents produce no more than microvolts through megohm sources. The inputs are also internally diode clamped to the supplies. Thus, input filtering and input series protection are easily achievable. A return path for the input bias currents must always be provided to prevent the charging of any stray capacitance. Otherwise, the amplifier could wander and saturate. A 1MΩ to 10MΩ resistor from the input to common will return floating sources such as thermocouples and AC-coupled inputs (see Applications Section, Figures 8 and 9.)
DYNAMIC PERFORMANCE
The PGA202 and the PGA203 are fast-settling FET input programmable gain instrumentation amplifiers. Careful at- tention to minimize stray capacitance is necessary to achieve specified performance. High source resistance will interact with the input capacitance to reduce speed and overall bandwidth. Also, to maintain stability, avoid capacitance from the output to the input or the offset adjust pins. Applications with balanced source impedance will provide the best performance. In some applications, mismatched source impedances may be required. If the impedance in the negative input exceeds that in the positive input, stray capacitance from the output will create a net negative feed-
back and improve the stability of the circuit. If, however, the impedance in the positive input is greater, then the feedback due to stray capacitance will be positive and instability may result. The degree of positive feedback will, of course, depend on the source impedance imbalance as well as the board layout and the operating gain. The addition of a small bypass capacitor of about 5 to 50pF directly across the input terminals of the PGIA will generally eliminate any instability arising from these stray capacitances. CMR errors due to the source imbalance will also be reduced by the addition of this capacitor. The PGA202 and the PGA203 are designed for fast settling
in response to changes in either the input voltage or the gain. The bandwidth and the settling times are mostly determined by the output stage and are therefore independent of gain, except at the highest gain of the PGA202 where other factors in the input stage begin to dominate.
APPLICATIONS
In addition to general purpose applications, the PGA202/203 are designed to handle two important and demanding classes of applications: inputs with high source impedances, and rapid scanning data acquisition systems requiring fast settling time. Because the user has access to output sense and output common pins, current sources can also be constructed with a minimum of external components. Some basic application circuits are shown in Figures 6 through 12.
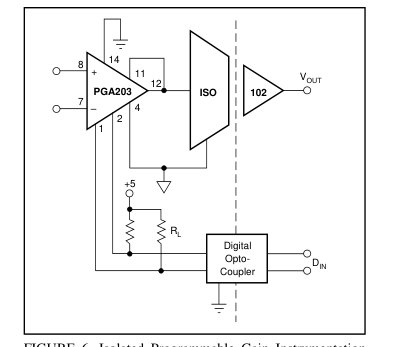
FIGURE 6. Isolated Programmable Gain Instrumentation
Amplifier.
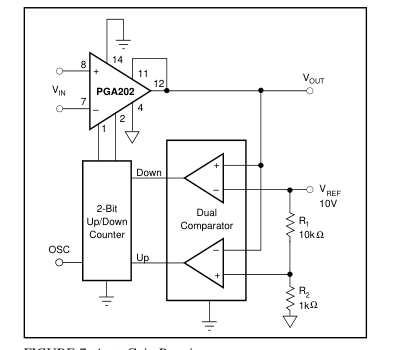
FIGURE 7. Auto Gain Ranging.
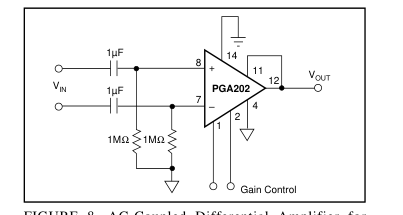
FIGURE 8. AC-Coupled Differential Amplifier for Frequencies Above 0.16Hz.
Page 10
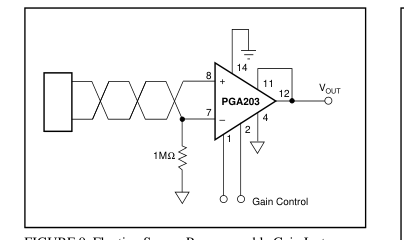
FIGURE 9. Floating Source Programmable Gain Instrumentation Amplifier.
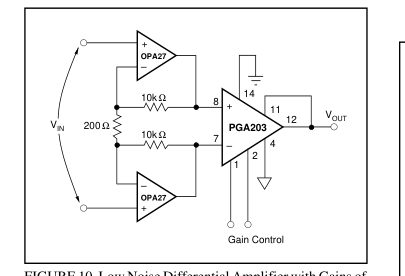
FIGURE 10. Low Noise Differential Amplifier with Gains of 100, 200, 400, 800.
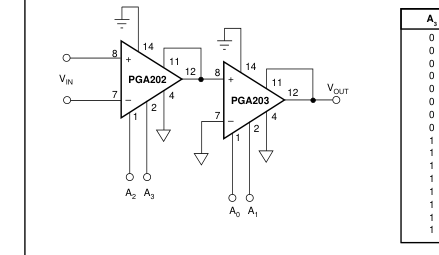
FIGURE 13. Cascaded Amplifiers.
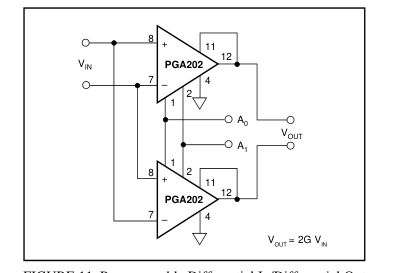
FIGURE 11. Programmable Differential In/Differential Out
Amplifier.
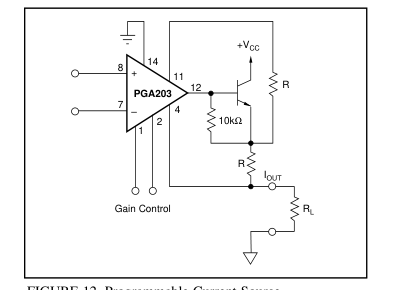
FIGURE 12. Programmable Current Source.
Page 11
PACKAGE OPTION ADDENDUM
11-Nov-2025
www.ti.com
PACKAGING INFORMATION

(1) Status: For more details on status, see our product life cycle.
(2) Material type: When designated, preproduction parts are prototypes/experimental devices, and are not yet approved or released for full production. Testing and final process, including without limitation quality assurance, reliability performance testing, and/or process qualification, may not yet be complete, and this item is subject to further changes or possible discontinuation. If available for ordering, purchases will be subject to an additional waiver at checkout, and are intended for early internal evaluation purposes only. These items are sold without warranties of any kind.
(3) RoHS values: Yes, No, RoHS Exempt. See the TI RoHS Statement for additional information and value definition.
(4) Lead finish/Ball material: Parts may have multiple material finish options. Finish options are separated by a vertical ruled line. Lead finish/Ball material values may wrap to two lines if the finish value exceeds the maximum column width.
(5) MSL rating/Peak reflow: The moisture sensitivity level ratings and peak solder (reflow) temperatures. In the event that a part has multiple moisture sensitivity ratings, only the lowest level per JEDEC standards is shown. Refer to the shipping label for the actual reflow temperature that will be used to mount the part to the printed circuit board.
(6) Part marking: There may be an additional marking, which relates to the logo, the lot trace code information, or the environmental category of the part.
Multiple part markings will be inside parentheses. Only one part marking contained in parentheses and separated by a "~" will appear on a part. If a line is indented then it is a continuation of the previous line and the two combined represent the entire part marking for that device.
Important Information and Disclaimer:The information provided on this page represents TI's knowledge and belief as of the date that it is provided. TI bases its knowledge and belief on information provided by third parties, and makes no representation or warranty as to the accuracy of such information. Efforts are underway to better integrate information from third parties. TI has taken and continues to take reasonable steps to provide representative and accurate information but may not have conducted destructive testing or chemical analysis on incoming materials and chemicals. TI and TI suppliers consider certain information to be proprietary, and thus CAS numbers
and other limited information may not be available for release.
In no event shall TI's liability arising out of such information exceed the total purchase price of the TI part(s) at issue in this document sold by TI to Customer on an annual basis.
Addendum-Page 1
Page 12
PACKAGE MATERIALS INFORMATION
www.ti.com
10-Aug-2026
TUBE
T - Tube
height
L - Tube length

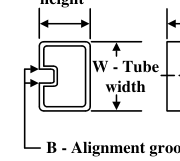
\*All dimensions are nominal
| Device | Package Name | Package Type | Pins | SPQ | L (mm) | W (mm) | T (µm) | B (mm) |
|---|---|---|---|---|---|---|---|---|
| PGA202KP | N | PDIP | 14 | 25 | 506 | 13.97 | 11230 | 4.32 |
| PGA202KP.A | N | PDIP | 14 | 25 | 506 | 13.97 | 11230 | 4.32 |
| PGA203KP | N | PDIP | 14 | 25 | 506 | 13.97 | 11230 | 4.32 |
| PGA203KP.A | N | PDIP | 14 | 25 | 506 | 13.97 | 11230 | 4.32 |
Pack Materials-Page 1
Page 13
IMPORTANT NOTICE AND DISCLAIMER
TI PROVIDES TECHNICAL AND RELIABILITY DATA (INCLUDING DATASHEETS), DESIGN RESOURCES (INCLUDING REFERENCE DESIGNS), APPLICATION OR OTHER DESIGN ADVICE, WEB TOOLS, SAFETY INFORMATION, AND OTHER RESOURCES “AS IS” AND WITH ALL FAULTS, AND DISCLAIMS ALL WARRANTIES, EXPRESS AND IMPLIED, INCLUDING WITHOUT LIMITATION ANY IMPLIED WARRANTIES OF MERCHANTABILITY, FITNESS FOR A PARTICULAR PURPOSE OR NON-INFRINGEMENT OF THIRD PARTY INTELLECTUAL PROPERTY RIGHTS. These resources are intended for skilled developers designing with TI products. You are solely responsible for (1) selecting the appropriate TI products for your application, (2) designing, validating and testing your application, and (3) ensuring your application meets applicable
standards, and any other safety, security, regulatory or other requirements. These resources are subject to change without notice. TI grants you permission to use these resources only for development of an application that uses the TI products described in the resource. Other reproduction and display of these resources is prohibited. No license is granted to any other TI intellectual property right or to any third party intellectual property right. TI disclaims responsibility for, and you fully indemnify TI and its representatives against any claims, damages, costs, losses, and liabilities arising out of your use of these resources. TI’s products are provided subject to TI’s Terms of Sale, TI’s General Quality Guidelines, or other applicable terms available either on
ti.com or provided in conjunction with such TI products. TI’s provision of these resources does not expand or otherwise alter TI’s applicable warranties or warranty disclaimers for TI products. Unless TI explicitly designates a product as custom or customer-specified, TI products are standard, catalog, general purpose devices. TI objects to and rejects any additional or different terms you may propose. IMPORTANT NOTICE
Copyright © 2026, Texas Instruments Incorporated
Last updated 10/2025