

 Download PDF
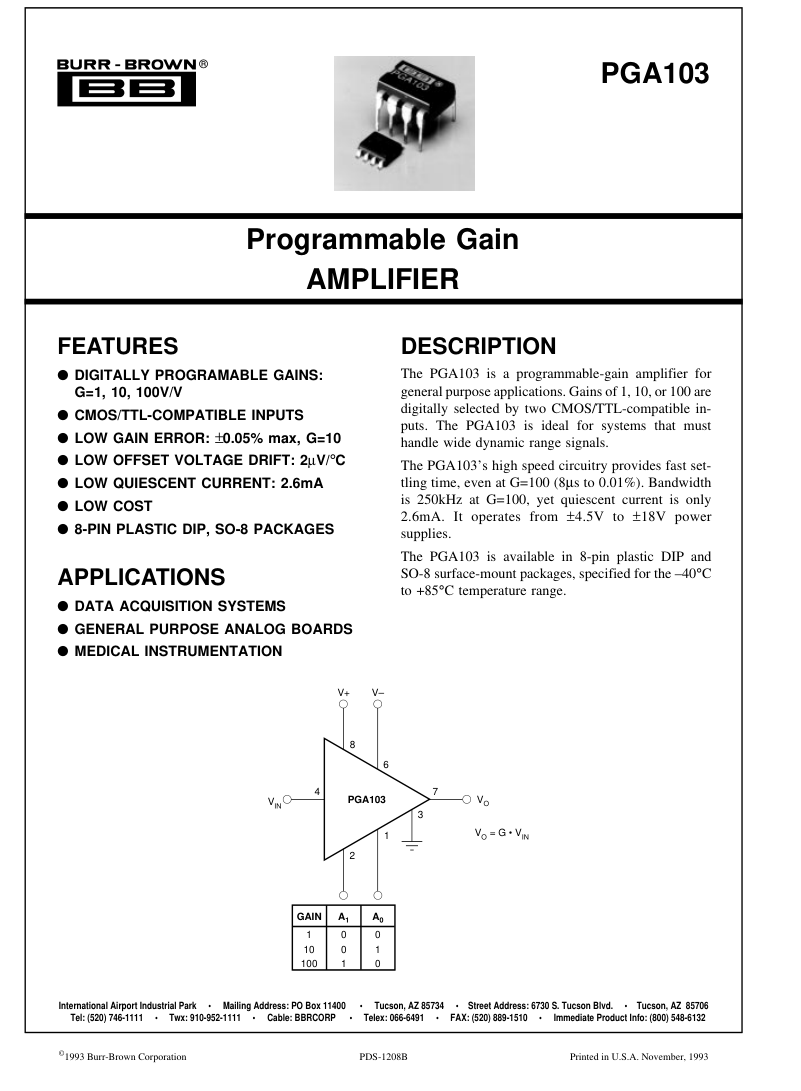
PGA103 BURR-BROWN
Document overview
- PDF pages: 7
Technical content
Page 1
Page 2
SPECIFICATIONS
ELECTRICAL
TA = +25°C, VS = ±15V, RL = 2kΩ unless otherwise specified.
Page 3
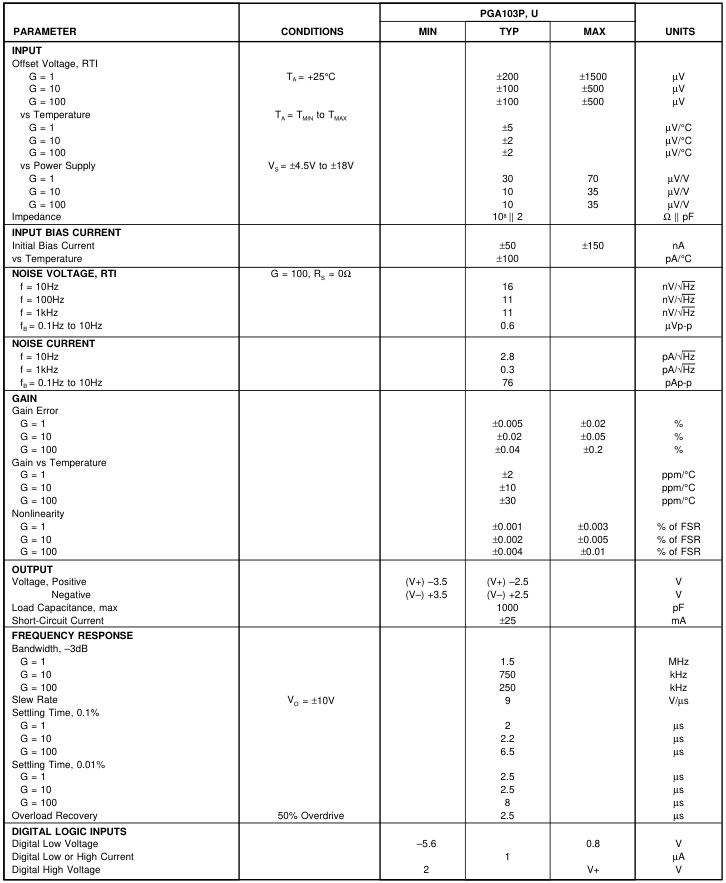
SPECIFICATIONS (CONT)
ELECTRICAL
TA = +25°C, VS = ±15V, RL = 2kΩ unless otherwise specified.

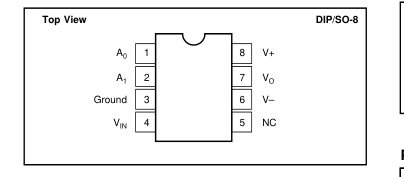
PIN CONFIGURATION
ORDERING INFORMATION
| MODEL | PACKAGE | TEMPERATURE RANGE |
| PGA103P PGA103U | 8-Pin Plastic DIP SO-8 Surface-Mount | –40°C to +85°C –40°C to +85°C |
ELECTROSTATIC
DISCHARGE SENSITIVITY
Any integrated circuit can be damaged by ESD. Burr-Brown
recommends that all integrated circuits be handled with ap-
propriate precautions. Failure to observe proper handling and
installation procedures can cause damage. ESD damage can range from subtle performance degradation
to complete device failure. Precision integrated circuits may
be more susceptible to damage because very small parametric
changes could cause the device not to meet published speci-
fications.
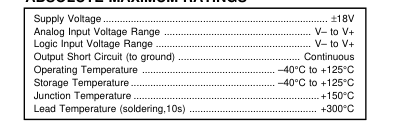
ABSOLUTE MAXIMUM RATINGS
PACKAGE INFORMATION
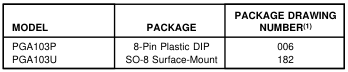
NOTE: (1) For detailed drawing and dimension table, please see end of data sheet, or Appendix D of Burr-Brown IC Data Book.

The information provided herein is believed to be reliable; however, BURR-BROWN assumes no responsibility for inaccuracies or omissions. BURR-BROWN assumes no responsibility for the use of this information, and all use of such information shall be entirely at the user’s own risk. Prices and specifications are subject to change without notice. No patent rights or licenses to any of the circuits described herein are implied or granted to any third party. BURR-BROWN does not authorize or warrant any BURR-BROWN product for use in life support devices and/or systems.
Page 4
DICE INFORMATION
| PAD | FUNCTION |
| 1 2 3A, 3B, 3C(1) 4A, 4B, 4C(2) 6 7 8 | A0 A 1 Ground V IN V– V O V+ |
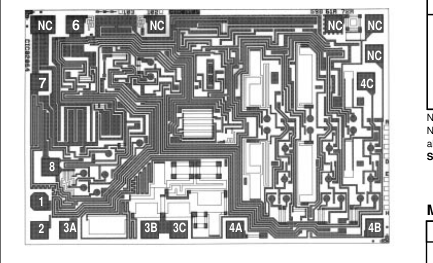
NC: No Connection NOTES: (1) Connect all three indicated pads. (2) Connect all three indicated pads. Substrate Bias: Internally connected to V– power supply.
MECHANICAL INFORMATION
TYPICAL PERFORMANCE CURVES
TA = +25°C, VS = ±15V unless otherwise noted.
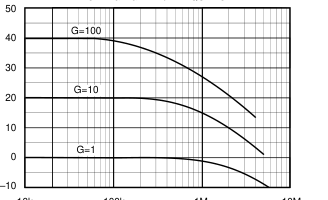
VOLTAGE GAIN vs FREQUENCY
10k
100k
1M
10M
Frequency (Hz)
| MILS (0.001") | MILLIMETERS | |
| Die Size Die Thickness Min. Pad Size | 69 x 105 ±5 20 ±3 4 x 4 | 1.75 x 2.67 ±0.13 0.51 ±0.08 0.1 x 0.1 |
| Backing Gold | ||
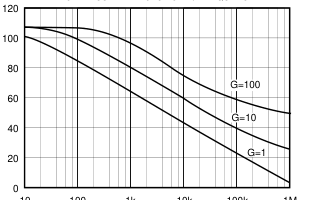
POWER SUPPLY REJECTION vs FREQUENCY
10 100 1k 10k 100k 1M
Frequency (Hz)
Page 5
TYPICAL PERFORMANCE CURVES (CONT)
TA = +25°C, VS = ±15V unless otherwise noted.
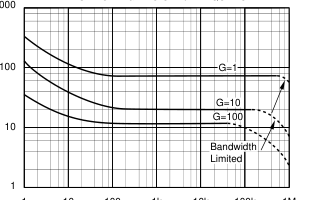
INPUT VOLTAGE NOISE vs FREQUENCY 1000
1 10 100 1k 10k 100k 1M
Frequency (Hz)
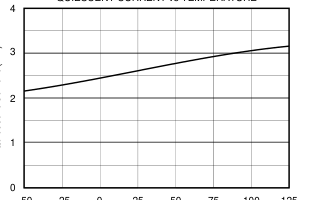
QUIESCENT CURRENT vs TEMPERATURE
–50 –25 0 25 50 75 100 125
Temperature (°C)
INPUT CURRENT NOISE vs FREQUENCY
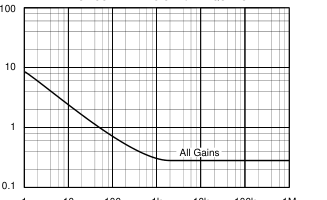
1 10 100 1k 10k 100k 1M
Frequency (Hz)
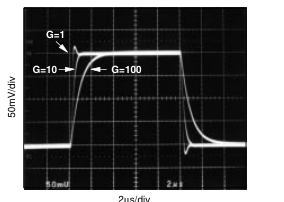
SMALL SIGNAL RESPONSE
LARGE SIGNAL RESPONSE
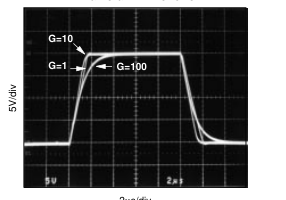
2µs/div
Page 6
APPLICATION INFORMATION
Figure 1 shows the basic connections required for operation of the PGA103. Applications with noisy or high impedance power supplies may require decoupling capacitors close to the device pins as shown.
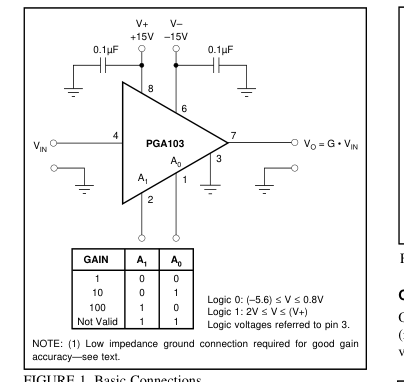
FIGURE 1. Basic Connections.
The input and output are referred to the ground terminal, pin 3. This must be a low-impedance connection to assure good gain accuracy. A resistance of 0.1Ω in series with the ground pin will cause the gain in G=100 to decrease by approximately 0.2%.
DIGITAL INPUTS
The digital inputs, A0 and A1, select the gain according to the logic table in Figure 1. The digital inputs interface directly to common CMOS and TTL logic components. The logic inputs are referenced to the ground terminal, pin 3. The logic table in Figure 1 shows that logic “1” on both A0 and A1 is invalid. This logic code will not cause damage, but the amplifier output will not be predictable while this code is selected. The output will recover when a valid code is selected. The digital inputs are not latched, so a change in logic inputs immediately selects a new gain. Switching time of the logic is approximately 0.5µs. The time to respond to gain change
is equal to the switching time plus the time it takes the amplifier to settle to a new output voltage in the newly selected gain (see settling time specifications). Many applications use an external logic latch to access gain control signals from a high speed data bus. Using an external latch isolates the high speed digital bus from sensitive analog circuitry. Locate the latch circuitry as far as practical from analog circuitry to avoid coupling digital noise into the analog circuitry.
Some applications select gain of the PGA103 with switches or jumpers. Figure 2 shows pull-up resistors connected to assure a noise-free logic “1” when the switch or jumper is off or open. Fixed-gain applications can connect the logic inputs directly to V+ or ground (or other valid logic level) without a series resistor.
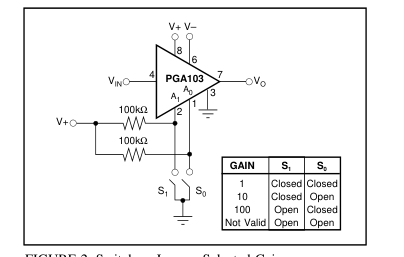
FIGURE 2. Switch or Jumper-Selected Gains.
OFFSET TRIMMING
Offset voltage is laser-trimmed to typically less than 200µV (referred to input) in all three gains. The input-referred offset voltage can be different for each gain.
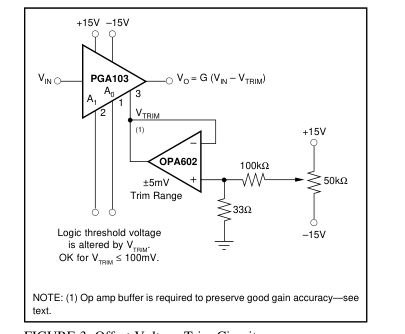
FIGURE 3. Offset Voltage Trim Circuit.
Figure 3 shows a circuit used to trim the offset voltage of the PGA103. An op amp buffers the trim voltage to provide a low impedance at the ground terminal. This is required to maintain accurate gain. Remember that the logic inputs, A0 and A1, are referenced to this ground connection, so the logic threshold voltage will be affected by the trim voltage. This is insignificant if the offset adjustment is used only to trim offset voltage. If a large offset is used (greater than 0.1V), be sure that the logic input signals provide valid logic levels when referred to the voltage at the ground terminal, pin 3.
Page 7
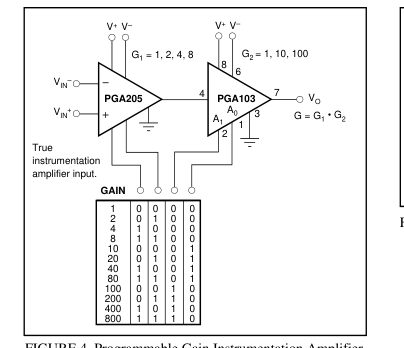
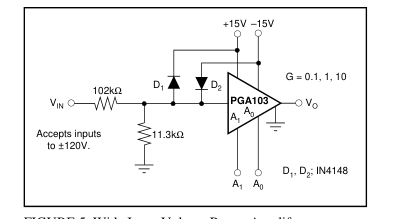
FIGURE 5. Wide Input Voltage Range Amplifer.
FIGURE 4. Programmable Gain Instrumentation Amplifier.
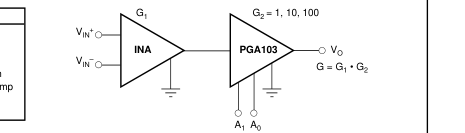
| MODEL | CHARACTERISTICS |
| INA103 INA105 INA106 INA114 INA117 INA111 INA131 | Low Noise, 1nV/√Hz IA G = 1 Difference Amp G = 10 Difference Amp Resistor-Programmed Gain, Precision ±200V C-M Input Range Difference Amp FET Input, High Speed IA Precision, G = 100 IA |