

 Download PDF
PFE1300-48-054NA BEL
Document overview
- PDF pages: 23
Technical content
Page 1

The PFE1300-48-054NA is a 1300 Watt AC to DC power-factor-
corrected (PFC) power supply that converts standard AC mains
power into a main output of 48 VDC for powering intermediate bus
architectures (IBA) in high performance and reliability servers,
routers, and network switches. The PFE1300-48-054NA meets
international safety standards and displays the CE-Mark for the
European Low Voltage Directive (LVD).

Best-in-class, “Platinum” efficiency
Wide input voltage range: 90-264 VAC
High Power Density design: 30.25 W/in3
Small form factor: 54.5 x 40.0 x 321.5 mm
AC input with power factor correction
Always-On 16.5 W programmable standby output (3.3/5 V)
Hot-plug capable
Parallel operation with active digital current sharing
I2C communication interface for control, programming and monitoring with PMBus™ protocol
Over temperature, output over voltage and over current protection 256 Bytes of EEPROM for user information 2 Status LEDs: AC OK and DC OK with fault signaling
High performance servers Routers Switches

Page 2
2
PFE
1300
- 48 - 054
N
A
Product Family
Power Level
V1 Output
Width
Airflow
Input
Dash
Dash
PFE Front-Ends
1300 W
48 V
54 mm
N: Normal
A: AC
\*PFE1300-48-054NAS407 has black front panel with white text
The PFE1300-48-054NA AC/DC power supply is combination of analog and DSP control, highly efficient front-end power supply.
It incorporates resonance-soft-switching technology to reduce component stresses, providing increased system reliability and very high efficiency. With a wide input operational voltage range and minimal linear derating of output power with input voltage and temperature, the PFE1300-48-054NA maximizes power availability in demanding server, network, and other high availability applications. The supply is fan cooled and ideally suited for integration with a matching airflow paths.
The PFC stage guarantee best efficiency and unity power factor over a wide operating range. The DC/DC stage uses soft switching resonant techniques in conjunction with synchronous rectification. An active OR-ing device on the output ensures no reverse load current and renders the supply ideally suited for operation in redundant power systems.
The always-on standby output, with selectable voltage level (3.3/5.0 Volts), provides power to external power distribution and management controllers. It is protected with an active OR-ing device for maximum reliability. Status information is provided with front-panel LEDs. In addition, the power supply can be controlled and the fan speed set via the I2C bus. The I2C bus allows full monitoring of the supply, including input and output voltage, current, power, and inside temperatures.
Cooling is managed by a fan controlled by the DSP controller. The fan speed is adjusted automatically depending on the actual power demand and supply temperature and can be overridden through the I2C bus.
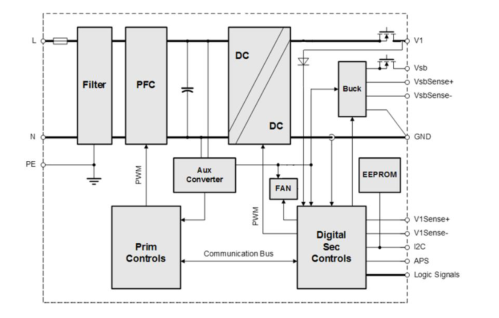
Figure 1 - PFE1300-48-054NA Block Diagram
Stresses in excess of the absolute maximum ratings may cause performance degradation, adversely affect long-term reliability, and cause permanent damage to the supply.
PARAMETER
DESCRIPTION / CONDITION
MIN NOM MAX
UNIT
Vi max Maximum Input
Continuous
264 VAC

Page 3
3
General Condition: TA = 0… 45 °C unless otherwise noted.
PARAMETER
DESCRIPTION / CONDITION
MIN NOM MAX
UNIT
Vi nom Nominal Input Voltage
100 230 240 VAC
Vi Input Voltage Ranges
Normal operating (Vi min to Vi max)
90
264 VAC

Ii max Max Input Current
Vin =110 VAC / 60 Hz, Full Load
12 Arms
Ii p Inrush Current Limitation
Vi min to Vi max, TNTC = 25°C (Figure 4)
50 Ap
Fi Input Frequency
47 50/60 64
Hz
PF Power Factor
Vi nom, 50 Hz, > 0.2 I1 nom
0.95
W/VA
Turn-on Input Voltage1) Vi on
Ramping up
85
90 VAC
Turn-off Input Voltage1) Vi off
Ramping down
75
83 VAC
Vi nom, 0.1∙Ix nom, Vx nom, TA = 25°C
87.0
Vi nom, 0.2∙Ix nom, Vx nom, TA = 25°C
92.0
η Efficiency without Fan
%
Vi nom, 0.5∙Ix nom, Vx nom, TA = 25°C
94.5
Vi nom, Ix nom, Vx nom, TA = 25°C
94.0
After last AC zero point, V1 > 42 V, VSB within
Thold Hold-up Time
10
mS
regulation, Vi = 230 VAC, Px nom
1) The Front-End is provided with a minimum hysteresis of 3 V during turn-on and turn-off within the ranges.
4.1 INPUT FUSE
Quick-acting 16 A input fuses (5 x 20 mm) in series with L line inside the power supply protect against severe defects. The fuses are not accessible from the outside and are therefore not serviceable parts.
4.2 INRUSH CURRENT
The AC-DC power supply exhibits an X-capacitance of only 3.2 μF, resulting in a low and short peak current, when the supply is connected to the mains. The internal bulk capacitor will be charged through an NTC which will limit the inrush current. NOTE: Do not repeat plug-in / out operations within a short time, or else the internal in-rush current limiting device (NTC) may not sufficiently cool down and excessive inrush current or component failure(s) may result.
4.3 INPUT UNDER-VOLTAGE
If the sinusoidal input voltage stays below the input under voltage lockout threshold Vi on, the supply will be inhibited. Once the input voltage returns within the normal operating range, the supply will return to normal operation again.
4.4 POWER FACTOR CORRECTION
Power factor correction (PFC) is achieved by controlling the input current waveform synchronously with the input voltage. An analog controller is implemented giving outstanding PFC results over a wide input voltage and load ranges. The input current will follow the shape of the input voltage.
4.5 EFFICIENCY
High efficiency (see Figure 2) is achieved by using state-of-the-art silicon power devices in conjunction with soft-transition topologies minimizing switching losses. Synchronous rectifiers on the output reduce the losses in the high current output path. The speed of the fan is digitally controlled to keep all components at an optimal operating temperature regardless of the ambient temperature and load conditions.

Page 4
4
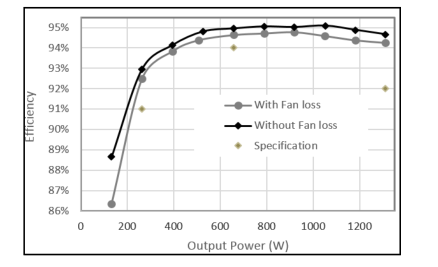
Figure 2 - Efficiency vs. Load Current
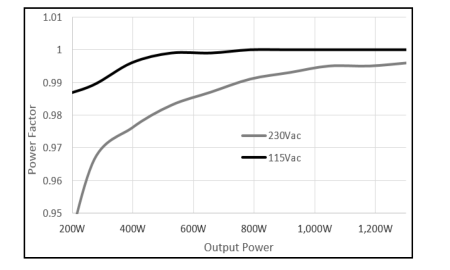
Figure 3 - Power Factor vs. Load Current
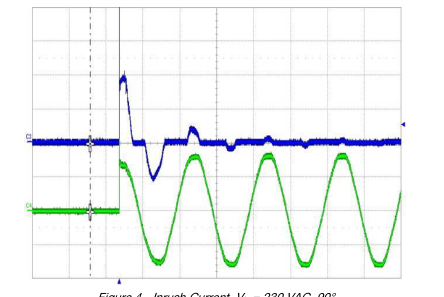
Figure 4 - Inrush Current, Vin = 230 VAC, 90° CH4: Vin (200 V/div), CH3: Iin (20 A/div)

Page 5
5
General Condition: Ta = 0 … +45 °C unless otherwise noted.
PARAMETER
DESCRIPTION / CONDITION
MIN NOM MAX
UNIT
Main Output V1
V1 nom Nominal Output Voltage
48.0
VDC
0.5 ∙I1 nom, Tamb = 25 °C
V1 set Output Setpoint Accuracy
-0.5
+0.5 % V1 nom
dV1 tot Total Regulation
Vi min to Vi max,0 to 100% I1 nom,Ta min to Ta max
-1
+1 % V1 nom
P1 nom Nominal Output Power
V1 = 48 VDC
1286
W
I1 nom Nominal Output Current
V1 = 48 VDC
26.8
ADC
v1 pp Output Ripple Voltage
V1 nom, I1 nom, 20 MHz BW (See Section 5.1)
600 mVpp
dV1 Load Load Regulation
Vi = Vi nom, 0 - 100 % I1 nom
480
mV
dV1 Line Line Regulation
Vi =Vi min…Vi max
480
mV

dIshare Current Sharing
Deviation from I1 tot / N, I1 > 10%
-3
+3 A
ΔI1 = 50% I1 nom, I1 = 5 - 100% I1 nom, 50 Hz -1 kHz
dVdyn Dynamic Load Regulation
-2.4
2.4 V
dI1/dt = 1A/μs, recovery within 1% of V1 nom 1 ΔI1 = 50% I1 nom, I1 = 5 - 100% I1 nom, 50 Hz -1 kHz
Trec Recovery Time
20 mS
dI1/dt = 1A/μs, recovery within 1% of V1 nom 1
tAC V1 Start-up Time from AC
V1 = 43.2 VDC
2 sec
tV1 rise Rise Time
V1 = 10…90% V1 nom
10 200 mS

dVSB tot Total Regulation
Vi min to Vi max,0 to 100% ISB nom,Ta min to Ta max
-3
+3 %VSBnom
VSB = 3.3 VDC , normal airflow
16.5
W
PSB nom Nominal Output Power
VSB = 5.0 VDC, normal airflow
16.5
W
VSB = 3.3 VDC, normal airflow
5
ADC
ISB nom Nominal Output Current
VSB = 5.0 VDC, normal airflow
3.3
ADC
VSB pp Output Ripple Voltage
VSB nom, ISB nom, 20 MHz BW (See Section 5.1)
100 mVpp
VSB_SEL = 1
40
dVSB Droop
0 - 100 % ISB nom
mV
VSB_SEL = 0
26.4
VSB_SEL = 1, normal airflow
5.25
6 ADC
ISB max Current Limitation
VSB_SEL = 0, normal airflow
3.45
4.3 ADC
dVSBdyn Dynamic Load Regulation
-5
5 %VSBnom
ΔISB = 50% ISB nom, ISB = 5 … 100% ISB nom, dIo/dt = 0.5 A/μs, recovery within 2% of Vsb nom
μs
Trec Recovery Time
250
tAC VSB Start-up Time from AC
VSB = 90% VSB nom
2 sec
tVSB rise Rise Time
VSB = 10…90% VSB nom (no capacitive loading)
4 20 mS
μF
CLoad Capacitive Loading
Tamb = 25°C, CR mode
10000

Page 6
6
5.1 OUTPUT VOLTAGE RIPPLE
Internal capacitance at the 48 V output (behind the OR-ing circuitry) is minimized to prevent disturbances during hot plug. In order to provide low output ripple voltage in the application, external capacitors should be added close to the power supply output.
The setup of Figure 5 has been used to evaluate suitable capacitor types. The capacitor combinations of Table 1 and Table 2 should be used to reduce the output ripple voltage. The ripple voltage is measured with 20 MHz BWL, close to the external capacitors.
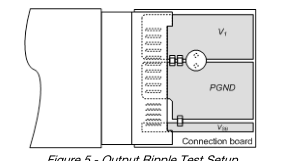
Figure 5 - Output Ripple Test Setup
Note: Care must be taken when using ceramic capacitors with a total capacitance of 1 µF to 50 µF on output V1, due to their high quality factor the output ripple voltage may be increased in certain frequency ranges due to resonance effects.
Table 1 - Suitable Capacitors for V1
External capacitor V1
dV1max
Unit
1 Pc 10 µF / 63 V Electrolytic Capacitor
550
mVpp
1 pc 0.1 uF / 100 V ceramic capacitor 1 Pc 82 µF / 63 V / Conductive Polyer/ø10 x 12.5 mm
400
mVpp
Table 2 - Suitable capacitors for VSB
External capacitor VSB
dV1max
Unit
1 Pc 10 µF / 25 V MLCC
80
mVpp
1 pc 0.1 uF / 25 V MLCC 2 Pcs 10 µF / 25 V MLCC
40
mVpp
1 pc 0.1 uF / 25 V MLCC
The output ripple voltage on VSB is influenced by the main output V1. Evaluating VSB output ripple must be done when maximum load is applied to V1.
PARAMETER
DESCRIPTION / CONDITION
MIN NOM MAX
UNIT
F Input Fuses L
Not user accessible, quick-acting (F)
16
A
V1 OV OV Threshold V1
57
59.5 VDC
tOV V1 OV Latch Off Time V1
1 mS
VSB OV OV Threshold VSB
110
120 % VSB
tOV VSB OV Latch Off Time VSB
1 mS

IV1 SC Max Short Circuit Current V1
V1 < 3 V
50 A
tV1 SC Short Circuit Regulation Time
V1 < 3 V, time until IV1 is limited to < IV1 sc
2 mS
tV1 SC off Short Circuit Latch Off Time
Time to latch off when in short circuit
200 mS
TSD Over Temperature On Heat Sinks Automatic shut-down
100
115 °C

Page 7
7
6.1 OVERVOLTAGE PROTECTION
The PFE front-ends provide a fixed threshold overvoltage (OV) protection implemented with a HW comparator. Once an OV condition has been triggered, the supply will shut down and latch the fault condition. The latch can be unlocked by disconnecting the supply from the AC mains or by toggling the PSON_L input.
6.2 VSB UNDERVOLTAGE DETECTION
Both main and standby outputs are monitored. LED and PWOK_H pin signal status change if the output voltage exceeds ±5% of its nominal voltage. Output undervoltage protection is provided on the standby output only. When VSB falls below 75% of its nominal voltage, the main output V1 is inhibited.
6.3 CURRENT LIMITATION
6.3.1 Main Output
When main output runs in current limitation mode its output will turn OFF below 2V but will retry to recover every 1s interval. If current limitation mode is still present after the unit retry, output will continuously perform this routine until current is below the current limitation point. The supply will go through soft start every time it retry from current limitation mode.
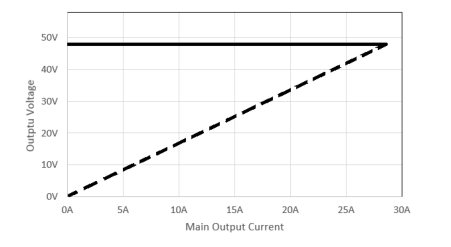
Figure 6 - Current Limitation on V1 (Vi = 230 VAC)
The main output current limitation will decrease if the ambient (inlet) temperature increases above 45°C or if the AC input voltage is too low (see Figure 7A or 7B). Note that the actual current limitation on V1 will begin at a current level approximately 75 W higher than what is shown in Figure 7A or 7B. (See also Chapter 9 Temperature and Fan Control for additional information. For European application, derating curve is different from North American application in low line condition as input current limitation for AC input connector is different.)
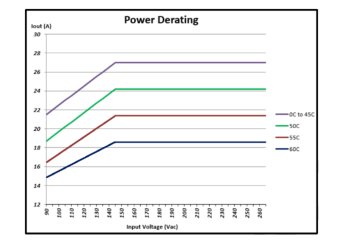
Figure 7A – Current on V1 vs. Vin and Ta for PFE1300-48-054NA For North America

Page 8
8
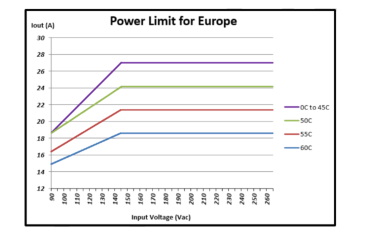
Figure 7B – Current on V1 vs. Vin and Ta for PFE1300-48-054NA For Europe
(Refer to Safety Installation Instruction for details)
6.3.2 Standby Output
The standby output exhibits a substantially rectangular output characteristic down to 0 V (no hiccup mode / latch off). If it runs in current limitation and its output voltage drops below the UV threshold, then the main output will be inhibited (standby remains on). The current limitation of the standby output is independent of the AC input voltage.
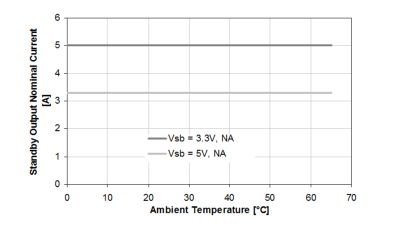
Figure 8 – Current Limitation on VSB
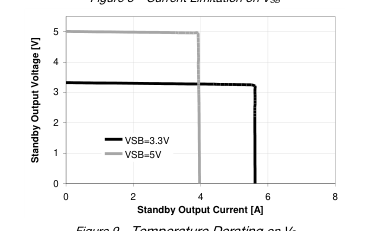
Figure 9 - Temperature Derating on VS

Page 9
PARAMETER
DESCRIPTION / CONDITION
Vi min ≤ Vi ≤ Vi max
Vi mon Input RMS Voltage
Ii > 4Arms
Ii mon Input RMS Current
Ii ≤ 4 Arms Po > 260 W, Vi = Vi nom
Pi mon True Input Power
130 W < Po ≤ 260 W, Vi = Vi nom
V1 mon V1 Voltage
I1 >10 A
I1 mon V1 Current
I1 ≤ 10 A Po > 260 W
Po mon Total Output Power
Po ≤ 260 W
VSB mon Standby Voltage
ISB ≤ ISB nom
ISB mon Standby Current
8.1 ELECTRICAL CHARACTERISTICS
PARAMETER
DESCRIPTION / CONDITION
PSKILL_H / PSON_L / VSB_SEL / HOTSTANDBYEN_H Inputs
VIL
Input Low Level Voltage
VIH
Input High Level Voltage
IIL, H
Maximum Input Sink or Source Current
RpuPSKILL_H
Internal Pull Up Resistor on PSKILL_H
RpuPSON_L
Internal Pull Up Resistor on PSON_L
RpuVSB_SEL
Internal Pull Up Resistor on VSB_SEL Internal Pull Up Resistor on
RpuHOTSTANDBYEN_H
HOTSTANDBYEN_H
RLOW
Resistance Pin to SGND for Low Level
RHIGH
Resistance Pin to SGND for High Level
PWOK_H Output
VOL
Output Low Level Voltage
Isink < 4 mA
VOH
Output High Level Voltage
Isource < 0.5 mA
RpuPWOK_H
Internal Pull Up Resistor on PWOK_H
ACOK_H Output
VOL
Output Low Level Voltage
Isink < 2 mA
VOH
Output High Level Voltage
Isource < 50 µA
RpuACOK_H
Internal Pull Up Resistor on ACOK_H
SMB_ALERT_L Output
Vext
Maximum External Pull Up Voltage
VOL
Output Low Level Voltage
Isource < 4 mA
IOH
Maximum High Level Leakage Current Internal Pull Up Resistor on
RpuSMB_ALERT_L
SMB_ALERT_L

9
MIN NOM MAX UNIT
-2.5
+2.5 %
-5
5 %
-0.3
+0.3 Arms
-7
+7 %
-25
+25 %
-2
+2 %
-2
+2 %
-0.3
+0.3 A
-5
+5 %
-13
+13 W
-0.1
+0.1 V
-0.2
+0.2 A
MIN NOM MAX UNIT
-0.2
0.8 V
2.4
3.5 V
0
1 mA
kΩ
10
kΩ
10
kΩ
10
kΩ
10
kΩ
0
1
kΩ
50
0
0.4 V
2.6
3.5 V
kΩ
1
0
0.4 V
2.6
3.5 V
kΩ
10
12 V
0
0.4 V
10 µA
kΩ
None
Page 10
10
8.2 INTERFACING WITH SIGNALS
All signal pins have protection diodes implemented to protect internal circuits. When the power supply is not powered, the protection devices start clamping at signal pin voltages exceeding ±0.5 V. Therefore all input signals should be driven only by an open collector/drain to prevent back feeding inputs when the power supply is switched off.
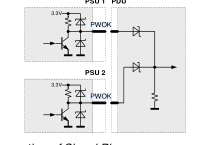
If interconnecting of signal pins of several power supplies is required, then this should be done by decoupling with small signal schottky diodes as shown in examples in Figure 10 (except for SMB_ALERT_L, ISHARE and I2C pins). This will ensure the pin voltage is not affected by an unpowered power supply.
SMB_ALERT_L pins can be interconnected without decoupling diodes, since these pins have no internal pull up resistor and use a 15 V zener diode as protection device against positive voltage on pins.
ISHARE pins must be interconnected without any additional components. This in-/output is disconnected from internal circuits when the power supply is switched off.
PSU 1 PDU
PSU 1 PDU
3.3V
VSB_SEL
PSU 2 3.3V
VSB_SEL
Figure 10 - Interconnection of Signal Pins
8.3 FRONT LEDs
The front-end has 2 front LEDs showing the status of the supply. LED number one is green and indicates AC power is on or off, while LED number two is bi-colored: green and yellow, and indicates DC power presence or fault situations. For the status of the LEDs see Table 3 lists the different LED status.
OPERATING CONDITION
LED SIGNALING
AC LED
AC Line within range
Solid Green
AC Line UV condition
Off
DC LED 1)
PSON_L High
Blinking Yellow (1:1)
Hot-Standby Mode
Blinking Yellow/Green (1:2)

Over temperature warning
Blinking Yellow/Green (2:1)
Minor fan regulation error (> 5%, < 15%)
Blinking Yellow/Green (1:1)
1) The order of the criteria in the table corresponds to the testing precedence in the controller.
Table 3 - LED Status

Page 11
11
8.4 PRESENT_L
This signaling pin is recessed within the connector and will contact only once all other connector contacts are closed. This active-low pin is used to indicate to a power distribution unit controller that a supply is plugged in. The maximum current on PRESENT_L pin should not exceed 10 mA.
PFE
PDU
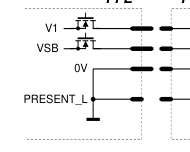
Figure 11 - PRESENT_L Signal Pin
8.5 PSKILL_H INPUT
The PSKILL_H input is active-high and is located on a recessed pin on the connector and is used to disconnect the main output as soon as the power supply is being plugged out. This pin should be connected to SGND in the power distribution unit. The standby output will remain on regardless of the PSKILL_H input state.
8.6 AC TURN-ON / DROP-OUTS / ACOK_H
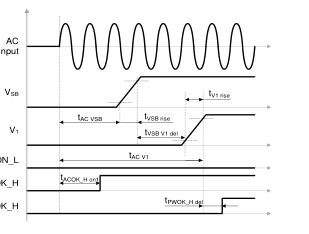
The power supply will automatically turn-on when connected to the AC line under the condition that the PSON_L signal is pulled low and the AC line is within range. The ACOK_H signal is active-high. The timing diagram is shown in Figure 12 and referenced in Table 4.
OPERATING CONDITION
MIN MAX UNIT
tAC VSB AC Line to 90% VVSB
2 sec
tAC V1 AC Line to 90% V1
2 sec
tACOK_H on1 ACOK_H signal on delay (start-up)
500 mS
tACOK_H on2 ACOK_H signal on delay (dips)
100 mS
tACOK_H off ACOK_H signal off delay
5 mS
tVSB V1 del VSB to V1 delay
10 500 mS
tV1 holdup Effective V1 holdup time
10
mS
tVSB holdup Effective VSB holdup time
20
mS
PSON_L
tACOK_H V1 ACOK_H to V1 holdup
7 mS
ACOK_H
tACOK_H VSB ACOK_H to VSB holdup
15
mS PWOK_H
tV1 off Minimum V1 off time
2000 mS
tVSB off Minimum VSB off time
2000 mS
Figure 12 – AC Turn-on Timing
Table 4 - AC Turn-on / Dip Timing

Page 12
12
PSON_L
PSON_L
ACOK_H
ACOK_H
PWOK_H
PWOK_H
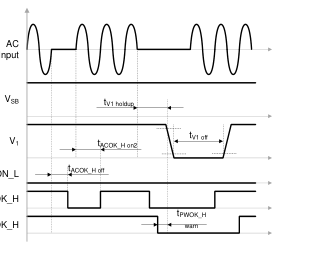
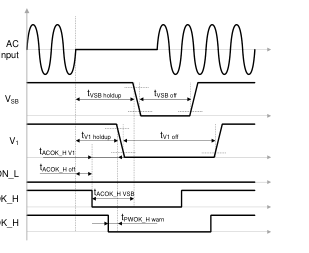
Figure 14 – AC Long Dips (above 50 mS)
Figure 13 - AC Short Dips (below 50 mS)
8.7 PSON_L INPUT
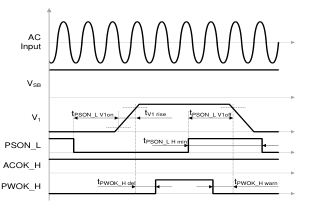
The PSON_L is an internally pulled-up (3.3 V) input signal to enable/disable the main output V1 of the front-end. This active-low pin is also used to clear any latched fault condition. The timing diagram is given in Figure 15 and the parameters in Table 5.
OPERATING CONDITION
MIN
MAX
UNIT
tPSON_L V1on
PSON_L to V1 delay (on)
10
250
mS
tPSON_L V1off
PSON_L to V1 delay (off)
10
250
mS
tPSON_L H min
PSON_L minimum High time
10
mS
Table 5 - PSON_L Timing
8.8 PWOK_H SIGNAL
The PWOK_H is an open drain output with an internal pull-up to 3.3 V indicating whether both VSB is within regulation and V1 is above 43.2V. The timing diagram is shown in Figure 12 / Figure 15 and referenced in the Table 6.
OPERATING CONDITION
MIN MAX UNIT
tPWOK_H del PWOK_H to V1 delay (on)
100 500 mS
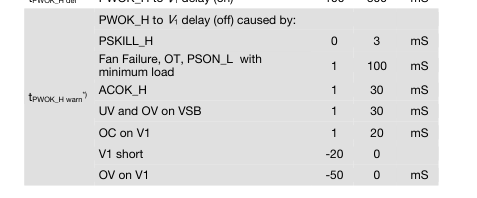
Figure 15 - PSON_L turn-on/off Timing
\*) A positive value means a warning time, a negative value a delay (after fact). \*) Test must be done with minimum load of 0.5A load on V1 and no capacitive load
Table 6 – PWOK_H Timing

Page 13
13
8.9 CURRENT SHARE
The PFE front-ends have an active current share scheme implemented for V1. All the ISHARE current share pins need to be interconnected in order to activate the sharing function. If a supply has an internal fault or is not turned on, it will disconnect its ISHARE pin from the share bus. This will prevent dragging the output down (or up) in such cases.
The current share function uses a digital bi-directional data exchange on a recessive bus configuration to transmit and receive current share information. The controller implements a Master/Slave current share function. The power supply providing the largest current among the group is automatically the Master. The other supplies will operate as Slaves and increase their output current to a value close to the Master by slightly increasing their output voltage. The voltage increase is limited to +1V.
The standby output uses a passive current share method (droop output voltage characteristic).
8.10 SENSE INPUTS
Both main and standby outputs have sense lines implemented to compensate for voltage drop on load wires. The maximum allowed voltage drop is 200 mV on the positive rail and 100 mV on the PGND rail.
With open sense inputs the main output voltage will rise by 800 mV and the standby output by 50 mV. Therefore if not used, these inputs should be connected to the power output and PGND close to the power supply connector. The sense inputs are protected against short circuit. In this case the power supply will shut down.
8.11 HOT-STANDBY OPERATION
The hot-standby operation is an operating mode allowing to further increase efficiency at light load conditions in a redundant power supply system. Under specific conditions one of the power supplies is allowed to disable its DC/DC stage. This will save the power losses associated with this power supply and at the same time the other power supply will operate in a load range having a better efficiency. In order to enable the hot standby operation, the HOTSTANDBYEN_H and the ISHARE pins need to be interconnected. A power supply will only be allowed to enter the hot-standby mode, when the HOTSTANDBYEN_H pin is high, the load current is low (see Figure 16) and the supply was
allowed to enter the hot-standby mode by the system controller via the appropriate I2C command (by default disabled). The system controller needs to ensure that only one of the power supplies is allowed to enter the hot-standby mode.
If a power supply is in a fault condition, it will pull low its active-high HOTSTANDBYEN_H pin which indicates to the other power supply that it is not allowed to enter the hot-standby mode or that it needs to return to normal operation should it already have been in the hot-standby mode. NOTE: The system controller needs to ensure that only one of the power supplies is allowed to enter the hot-standby model.
Figure 17 shows the achievable power loss savings when using the hot-standby mode operation. A total power loss reduction of 22% is achievable.
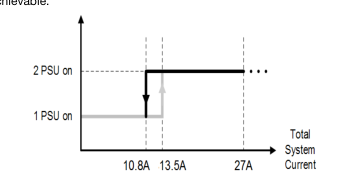
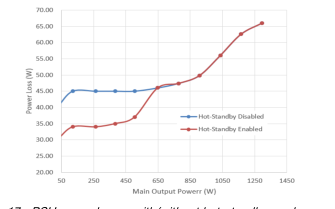
Figure 16 - Hot-standby enable/disable current thresholds
Figure 17 - PSU power losses with/without hot-standby mode
PSU 1
PSU 2
VSB
VSB
CS
HOTSTANDBYEN
HOTSTANDBYEN
PRESENT_L
PRESENT_L
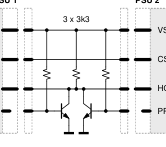
Figure 18 - Recommended Hot-standby Configuration

Page 14
14
In order to prevent voltage dips when the active power supply is unplugged while the other is in hot-standby mode, it is strongly recommended to add the external circuit as shown in Figure 18 If the PRESENT_L pin status needs also to be read by the system controller, it is recommended to exchange the bipolar transistors with small signal MOS transistors or with digital transistors.
8.12 I2C / SMBUS COMMUNICATION
The interface driver in the PFE supply is referenced to the V1 Return. The PFE supply is a communication Slave device only; it never initiates messages on the I2C/SMBus by itself. The communication bus voltage and timing is defined in Table 7 further characterized through:
| RX TX | 3.3/5V R pull-up |
There are no internal pull-up resistors The SDA/SCL IOs are 3.3 / 5 V tolerant Full SMBus clock speed of 100 kbps Clock stretching limited to 1 mS
SDA/SCL
SCL low time-out of > 25 mS with recovery within 10 mS Recognizes any time Start/Stop bus conditions
Figure 19 - Physical layer of communication interface
The SMB_ALERT_L signal indicates that the power supply is experiencing a problem that the system agent should investigate. This is a logical OR of the Shutdown and Warning events.
Communication to the DSP or the EEPROM will be possible as long as the input AC voltage is provided. If no AC is present, communication to the unit is possible as long as it is connected to a life V1 output (provided e.g. by the redundant unit). If only VSB is provided, communication is not possible.
PARAMETER
DESCRIPTION
CONDITION
MIN
MAX
UNIT
ViL Input low voltage
-0.5
1.0
V
ViH Input high voltage
2.3
5.5
V
Vhys Input hysteresis
0.15
V
VoL Output low voltage
3 mA sink current
0
0.4
V
20+0.1Cb1
tr Rise time for SDA and SCL
300
ns
Output fall time ViHmin ViLmax
10 pF < Cb1 < 400 pF
20+0.1Cb1
tof
250
ns
μA
Ii Input current SCL/SDA
0.1 VDD < Vi < 0.9 VDD
-10
10
Ci Internal Capacitance for each SCL/SDA
50
pF
fSCL SCL clock frequency
0
100
kHz
fSCL ≤ 100 kHz
Ω
1000 ns / Cb1
Rpu External pull-up resistor
fSCL ≤ 100 kHz
μs
tHDSTA Hold time (repeated) START
4.0
fSCL ≤ 100 kHz
μs
tLOW Low period of the SCL clock
4.7
fSCL ≤ 100 kHz
μs
tHIGH High period of the SCL clock
4.0
fSCL ≤ 100 kHz
μs
tSUSTA Setup time for a repeated START
4.7
fSCL ≤ 100 kHz
μs
tHDDAT Data hold time
0
3.45
fSCL ≤ 100 kHz
tSUDAT Data setup time
250
ns
fSCL ≤ 100 kHz
μs
tSUSTO Setup time for STOP condition
4.0
fSCL ≤ 100 kHz
tBUF Bus free time between STOP and START
5
mS
1 Cb = Capacitance of bus line in pF, typically in the range of 10…400 pF.
Table 7 - I2C / SMBus Specification

Page 15
15
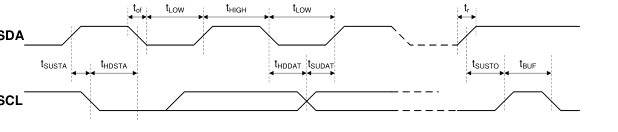
Figure 20 - I2C / SMBus Timing
8.13 ADDRESS SELECTION (APS)
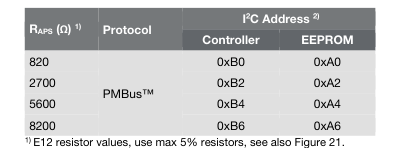
The APS pin provides the possibility to select the address by connecting a resistor to V1 return (0 V). A fixed addressing offset exists between the Controller and the EEPROM. NOTE: - If the APS pin is left open, the supply will operate with the PMBUS protocol at controller / EEPROM addresses 0xB6 / 0xA6. - The APS pin is only read at start-up of the power supply. Therefore it is not possible to change address dynamically
| 3.3V 12k ADC | APS |
RAPS
2) The LSB of the address byte is the R/W bit.
Figure 21 - I2C address and Protocol Setting
Table 8 - Address and Protocol Encoding
8.14 CONTROLLER AND EEPROM ACCESS
The controller and the EEPROM in the power supply share the same I2C bus physical layer (see Figure 22). An I2C driver device assures logic level shifting (3.3 / 5 V) and a glitch-free clock stretching. The driver also pulls the SDA/SCL line to nearly 0 V when driven low by the DSP or the EEPROM providing maximum flexibility when additional external bus repeaters are needed. Such repeaters usually encode the low state with different voltage levels depending on the transmission direction.
The DSP will automatically set the I2C address of the EEPROM with the necessary offset when its own address is changed / set. In order to write to the EEPROM, first the write protection needs to be disabled by sending the appropriate command to the DSP. By default the write protection is on.
The EEPROM provides 256 bytes of user memory. None of the bytes are used for the operation of the power supply.
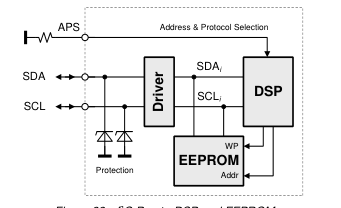
Figure 22 - I2C Bus to DSP and EEPROM

Page 16
16
8.15 EEPROM PROTOCOL
The EEPROM follows the industry communication protocols used for this type of device. Even though page write / read commands are defined, it is recommended to use the single byte write / read commands.
WRITE
The write command follows the SMBus 1.1 Write Byte protocol. After the device address with the write bit cleared a first byte with the data address to write to is sent followed by the data byte and the STOP condition. A new START condition on the bus should only occur after 5 mS of the last STOP condition to allow the EEPROM to write the data into its memory.
S Address W A
Data Address A
Data A P
READ
The read command follows the SMBus 1.1 Read Byte protocol. After the device address with the write bit cleared the data address byte is sent followed by a repeated start, the device address and the read bit set. The EEPROM will respond with the data byte at the specified location.
S Address W A
Data Address A
S Address R A
Data nA P
8.16 PMBUSTM PROTOCOL
The Power Management Bus (PMBus™) is an open standard protocol that defines means of communicating with power conversion and other devices. For more information, please see the System Management Interface Forum web site at: www.powerSIG.org.
PMBus™ command codes are not register addresses. They describe a specific command to be executed. The PFE1300-48-054NA supply supports the following basic command structures: Clock stretching limited to 1 mS SCL low time-out of > 25 mS with recovery within 10 mS Recognized any time Start/Stop bus conditions
WRITE
The write protocol is the SMBus 1.1 Write Byte/Word protocol. Note that the write protocol may end after the command byte or after the first data byte (Byte command) or then after sending 2 data bytes (Word command).
S Address W A
Command A
Data Low Byte1) A Data High Byte1) A
P
1) Optional
In addition, Block write commands are supported with a total maximum length of 255 bytes. See PFE1300-48-054NA Communication Manual for further information.
S Address W A
Command A Byte Count A
Byte 1 A
Byte N A P
READ
The read protocol is the SMBus 1.1 Read Byte/Word protocol. Note that the read protocol may request a single byte or word.
S Address W A
Command A
S Address R A Data (Low) Byte A Data High Byte1) nA P 1) Optional
In addition, Block read commands are supported with a total maximum length of 255 bytes. See PFE1300-48-054NA Communication Manual BCA.00006 for further information.
S Address W A
Command A S Address R
A
Byte Count A
Byte 1 A Byte N nA P

Page 17
17
8.17 GRAPHICAL USER INTERFACE
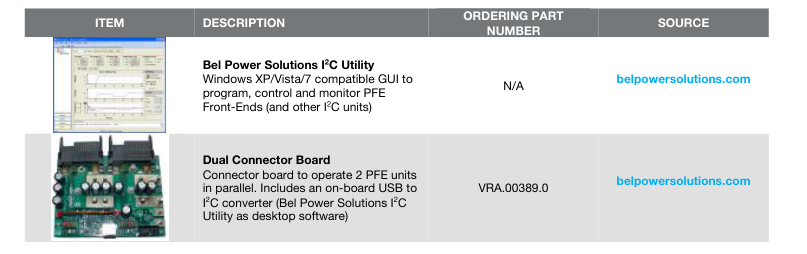
Bel Power Solutions provides with its “Bel Power Solutions I2C Utility” a Windows® XP/Vista/Win7 compatible graphical user interface allowing the programming and monitoring of the PFE1300-48-054NA Front-End. The utility can be downloaded on: www.belpowersolutions.com and supports PMBus™ protocols.
The GUI allows automatic discovery of the units connected to the communication bus and will show them in the navigation tree. In the monitoring view the power supply can be controlled and monitored.
If the GUI is used in conjunction with the PFE1300-48-054NA BOARD Evaluation Kit it is also possible to control the PSON_L pin(s) of the power supply.
The monitoring screen also allows to enable the hot-standby mode on the power supply. The mode status is monitored and by changing the load current it can be monitored when the power supply is being disabled for further energy savings. This obviously requires 2 power supplies being operated as a redundant system (as in the evaluation kit). NOTE: The user of the GUI needs to ensure that only one of the power supplies have the hot-standby mode enabled.
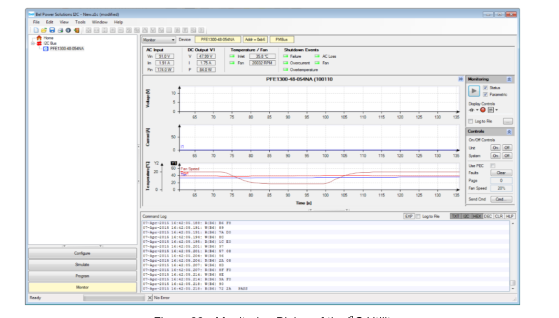
Figure 23 - Monitoring Dialog of the I2C Utility
To achieve best cooling results sufficient airflow through the supply must be ensured. Do not block or obstruct the airflow at the rear of the supply by placing large objects directly at the output connector. The PFE1300-48-054NA is provided with a normal airflow, which means the air enters through the DC-output of the supply and leaves at the AC-inlet. PFE supplies have been designed for horizontal operation.
The fan inside of the supply is controlled by a microprocessor. The rpm of the fan is adjusted to ensure optimal supply cooling and is a function of output power and the inlet temperature.
For the normal airflow version additional constraints apply because of the AC-connector. In a normal airflow unit, the hot air is exiting the power supply unit at the AC-inlet.
The IEC connector on the unit is rated 120°C. The input power is derated to ensure sufficient thermal margin is allotted to the mating connector. See Figure 26A or 26B. NOTE: It is the responsibility of the user to check the front temperature in such cases. The unit is not limiting its power automatically to meet such a temperature limitation.
Normal Airflow
Normal Airflow
Figure 24 - Airflow Direction

Page 18
18
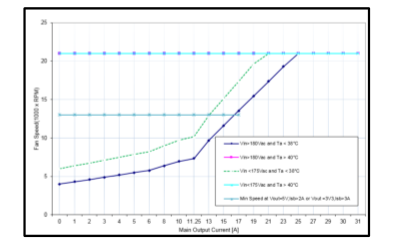
Figure 25 - Fan Speed vs Main Output Load for PFE1300-48-054NA
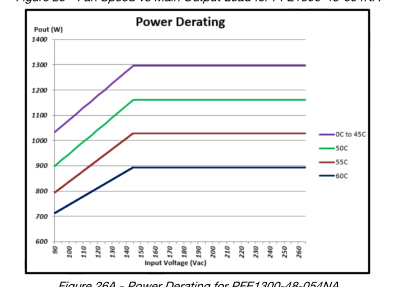
Figure 26A - Power Derating for PFE1300-48-054NA
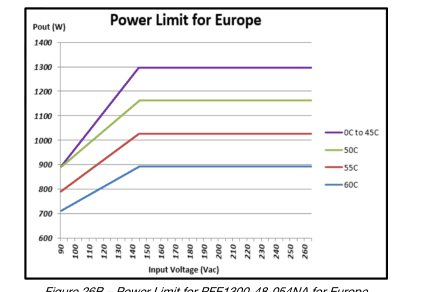
Figure 26B – Power Limit for PFE1300-48-054NA for Europe
(Refer to Safety Installation Instruction for details)

Page 19
10.1 IMMUNITY
NOTE: Most of the immunity requirements are derived from EN 55024:1998/A2:2003.
PARAMETER
DESCRIPTION / CONDITION
IEC / EN 61000-4-2, ±8 kV, 25+25 discharges per test point
ESD Contact Discharge
(metallic case, LEDs, connector body) IEC / EN 61000-4-2, ±15 kV, 25+25 discharges per test point
ESD Air Discharge
(non-metallic user accessible surfaces) IEC / EN 61000-4-3, 10 V/m, 1 kHz/80% Amplitude Modulation,
Radiated Electromagnetic Field
1 µs Pulse Modulation, 10 kHz…2 GHz IEC / EN 61000-4-4, level 3
Burst
AC port ±2 kV, 1 minute DC port ±1 kV, 1 minute IEC / EN 61000-4-5
Surge
Line to earth: level 3, ±2 kV Line to line: level 2, ±1 kV
RF Conducted Immunity
IEC/EN 61000-4-6, Level 3, 10 Vrms, CW, 0.1 … 80 MHz IEC/EN 61000-4-11 1: Vi 230 V, 100% Load, Phase 0 °, Dip 100%, Duration 10 mS
Voltage Dips and Interruptions
2: Vi 230 V, 100% Load, Phase 0 °, Dip 100%, Duration 20 mS 3: Vi 230 V, 100% Load, Phase 0 °, Dip 100%, Duration > 20 mS
1 V1 drops to 90 … 97% V1 nom for 3 mS.
10.2 EMISSION
PARAMETER
DESCRIPTION / CONDITION
EN55022 / CISPR 22: 0.15 … 30 MHz, QP and AVG, single unit
Conducted Emission
EN55022 / CISPR 22: 0.15 … 30 MHz, QP and AVG, 2 units in rack system
EN55022 / CISPR 22: 30 MHz … 1 GHz, QP, single unit
Radiated Emission
EN55022 / CISPR 22: 30 MHz … 1 GHz, QP, 2 units in rack system
Harmonic Emissions
IEC61000-3-2, Vin = 115 VAC / 60 Hz, & Vin = 230 VAC / 50 Hz, 100% Load
AC Flicker
IEC61000-3-3, Vin = 230 VAC / 50 Hz, 100% Load
19
CRITERION
B
B
A
B
VSB: A, V1: B1 A A
A VSB: A, V1: B VSB, V1: B
CRITERION
Class A 6 dB margin Class A 6 dB margin Class A 6 dB margin Class A 6 dB margin Class A
Pass
Maximum electric strength testing is performed according to IEC/EN 60950-1, and UL/CSA 60950-1. Input-to-output electric strength tests should not be repeated in the field. Bel Power Solutions will not honor any warranty claims resulting from electric strength field tests.
PARAMETER
DESCRIPTION / CONDITION
Approved to the latest edition of the following standards:
Agency Approvals
UL/CSA 60950-1, IEC60950-1 and EN60950-1
Input (L/N) to case (PE)
Isolation Strength
Input (L/N) to output
Output to case (PE)
Input to case
Electrical Strength Test
Input to output

MIN
NOM MAX UNIT
Approved by independent body (see CE Declaration) Basic
Reinforced
Functional
2121
VDC
4242
Page 20
20
PARAMETER
CONDITIONS / DESCRIPTION
MIN NOM MAX
UNIT
TA Ambient temperature
Vi min to Vi max, I1 nom, ISB nom
0
+45 °C
North America Application:
Full Power 1286W @ Vi 145-264 VAC
0
+45
Derated power (1032 to 1286 W) @ Vi 90-145 VAC
0
+45 °C
Derated power (893 to 1162 W) @ Vi 90-145 VAC
+45
+50
Derated power (792 to 1028 W) @ Vi 90-145 VAC
+50
+55
Derated power (716 to 893 W) @ Vi 90-145 VAC
+55
+60
(see Figure 7A and Figure 26 A)
TAext Extended temp range
Europe Application Power must be limited to: Full Power 1286W @ Vi 145-264 VAC
0
+45
Power Limit (893 to 1286 W) @ Vi 90-145 VAC
0
+45
Power Limit (893 to 1162 W) @ Vi 90-145 VAC
+45
+50 °C
Power Limit (792 to 1028 W) @ Vi 90-145 VAC
+50
+55
Power Limit (716 to 893 W) @ Vi 90-145 VAC
+55
+60
(see Figure 7B and Figure 26B)

PARAMETER
DESCRIPTION / CONDITION
MIN NOM
MAX
UNIT
Width
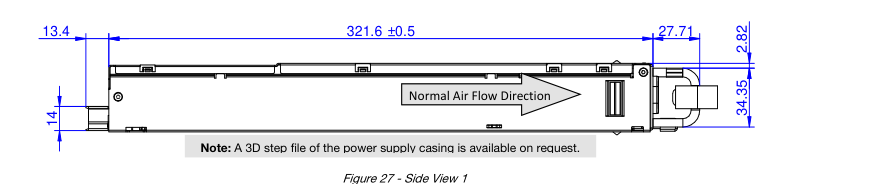
54.5
Dimensions
Height
40.0
mm
Depth
321.5
M Weight
1.09
kg

Page 21
21
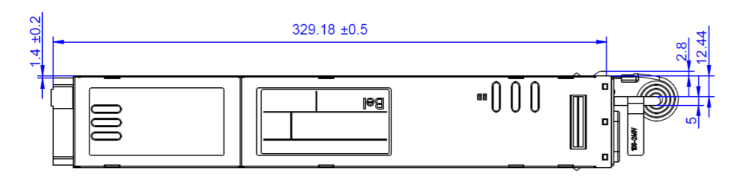
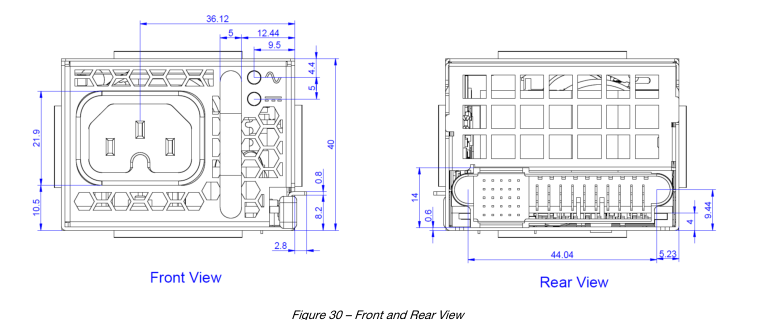
Figure 28 - Top View

Figure 29 - Side View 2

Page 22
22
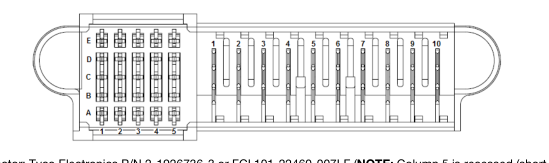
Power Supply Connector: Tyco Electronics P/N 2-1926736-3 or FCI 101-22460-007LF (NOTE: Column 5 is recessed (short pins)) Mating Connector: Tyco Electronics P/N 2-1926739-5 or FCI 10108888-R10253SLF
PIN
NAME
DESCRIPTION
Output 6, 7, 8, 9, 10 V1
+48 VDC main output
1, 2, 3, 4, 5 PGND
Power ground (return)
Control Pins A1
VSB
Standby positive output (+3.3/5 V)
B1
VSB
Standby positive output (+3.3/5 V)
C1
VSB
Standby positive output (+3.3/5 V)
D1
VSB
Standby positive output (+3.3/5 V)
E1
VSB
Standby positive output (+3.3/5 V)
A2
SGND
Signal ground (return)
B2
SGND
Signal ground (return) Hot standby enable signal: active-high
C2
HOTSTANDBYEN_H
D2
VSB_SENSE_R
Standby output negative sense
E2
VSB_SENSE
Standby output positive sense I2C address and protocol selection (select by a pull down resistor)
A3
APS
B3
N/C
Reserved I2C data signal line
C3
SDA
D3
V1_SENSE_R
Main output negative sense
E3
V1_SENSE
Main output positive sense I2C clock signal line
A4
SCL
B4
N/C
Reserved
C4
SMB_ALERT_L
SMB Alert signal output: active-low
Power supply on input (connect to A2/B2 to turn unit on): active-lo
D4
PSON_L
E4
ACOK_H
AC input OK signal: active-high
Power supply kill (lagging pin): active-high
A5
PSKILL_H
B5
ISHARE
Current share bus (lagging pin)
Power OK signal output (lagging pin): active-high
C5
PWOK_H
Standby voltage selection (lagging pin)
D5
VSB_SEL
Power supply present (lagging pin): active-low
E5
PRESENT_L

Page 23
23
NUCLEAR AND MEDICAL APPLICATIONS - Products are not designed or intended for use as critical components in life support systems, equipment used in hazardous environments, or nuclear control systems. TECHNICAL REVISIONS - The appearance of products, including safety agency certifications pictured on labels, may change depending on the date manufactured. Specifications are subject to change without notice.