

 Download PDF
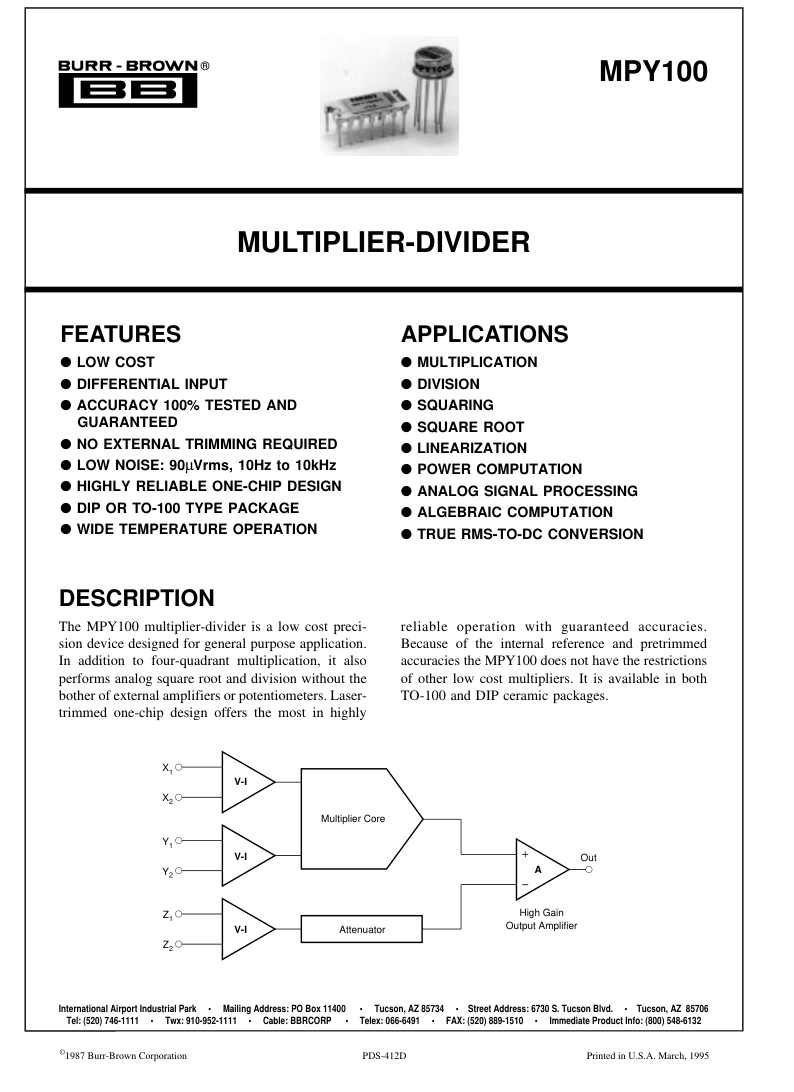
Multiplier/Divider datasheet
Document overview
- PDF pages: 16
Technical content
Page 1
SBFS012
Page 2
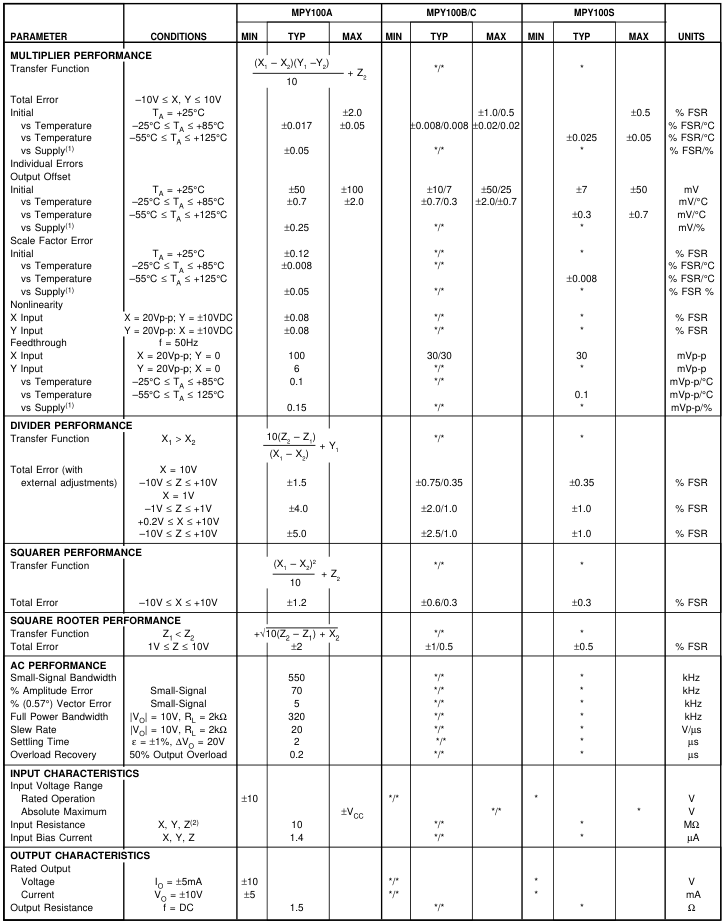
SPECIFICATIONS
At TA = +25°C and ±VS = 15VDC, unless otherwise specified.
Page 3
SPECIFICATIONS (CONT)
At TA = +25°C and ±VS = 15VDC, unless otherwise specified.
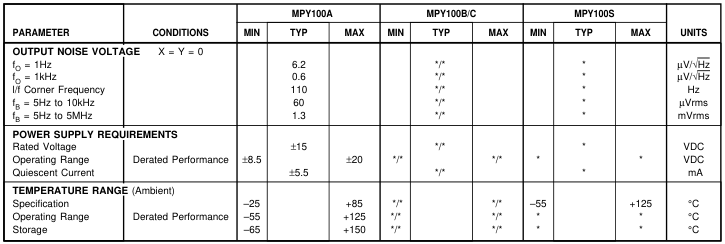
\* Same as MPY100A specification. \*/\* B/C grades same as MPY100A specification. NOTES: (1) Includes effects of recommended null pots. (2) Z2 input resistance is 10MΩ, typical, with VOS pin open. If VOS pin is grounded or used for optional offset adjustment, the Z2 input resistance may be as low as 25kΩ
PIN CONFIGURATIONS
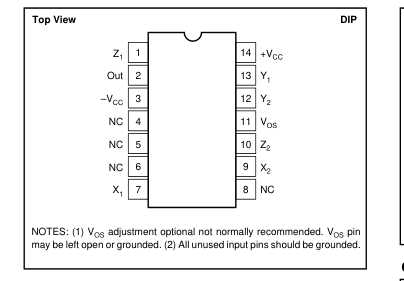
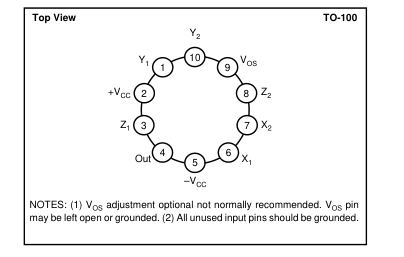
ORDERING INFORMATION
| MODEL | PACKAGE | TEMPERATURE RANGE |
| MPY100AG MPY100AM MPY100BG MPY100BM MPY100CG MPY100CM MPY100SG MPY100SM | 14-Pin Ceramic DIP Metal TO-100 14-Pin Ceramic DIP Metal TO-100 14-Pin Ceramic DIP Metal TO-100 14-Pin Ceramic DIP Metal TO-100 | –25°C to +85°C –25°C to +85°C –25°C to +85°C –25°C to +85°C –25°C to +85°C –25°C to +85°C –55°C to +125°C –55°C to +125°C |
ABSOLUTE MAXIMUM RATINGS
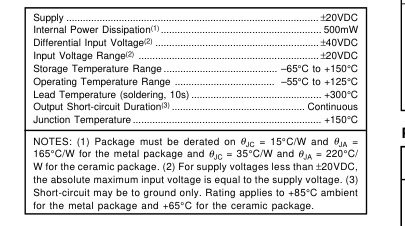
PACKAGE INFORMATION
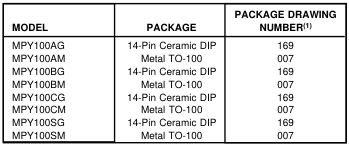
NOTE: (1) For detailed drawing and dimension table, please see end of data sheet, or Appendix D of Burr-Brown IC Data Book.
Page 4
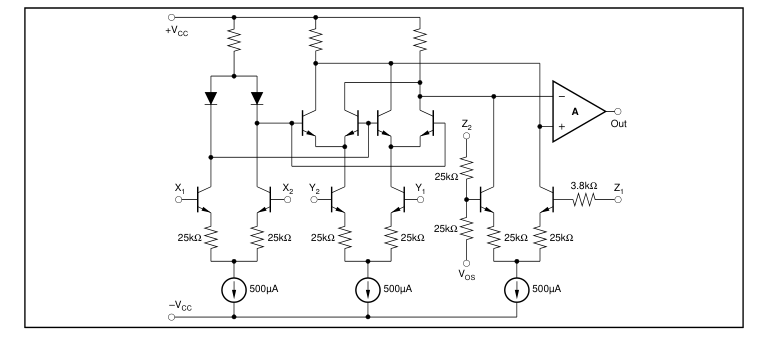
SIMPLIFIED SCHEMATIC
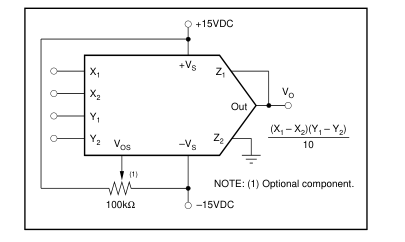
CONNECTION DIAGRAM
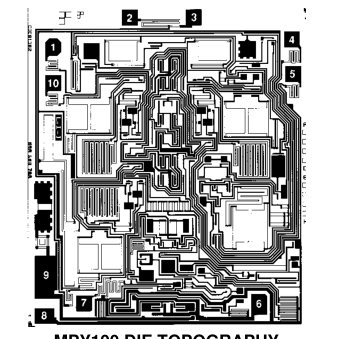
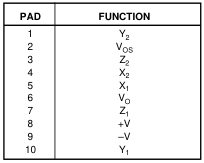
DICE INFORMATION

| MILS (0.001") | MILLIMETERS | |
| Die Size Die Thickness Min. Pad Size | 107 x 93 ±5 20 ±3 4 x 4 | 2.72 x 2.36 ±0.13 0.51 ±0.08 0.10 x 0.10 |
| Backing Gold | ||
MPY100 DIE TOPOGRAPHY
Page 5
TYPICAL PERFORMANCE CURVES
At TA = +25°C and ±VS = 15VDC, unless otherwise specified.
NONLINEARITY vs FREQUENCY
TOTAL ERROR vs AMBIENT TEMPERATURE
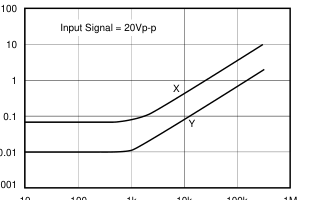
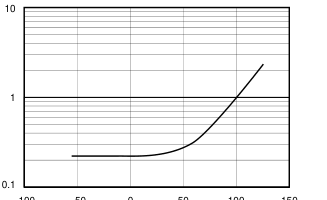
0.001 10
–100 –50 0
100 150
50
Ambient Temperature (°C)
FEEDTHROUGH vs FREQUENCY
100 1k
100k 1M
10k Frequency (Hz)
OUTPUT AMPLITUDE vs FREQUENCY
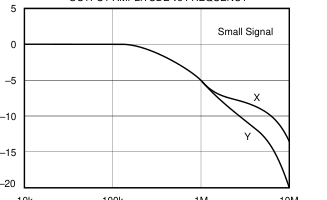
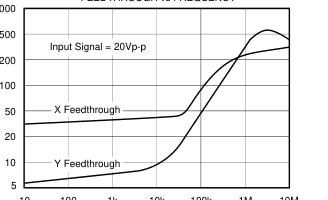
10k
1k 10k 100k
10 100
1M 10M
Frequency (Hz)
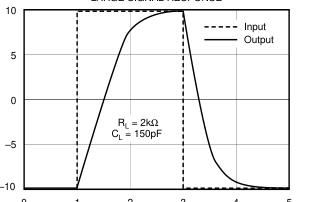
LARGE SIGNAL RESPONSE
100k
1M
10M
Frequency (Hz)
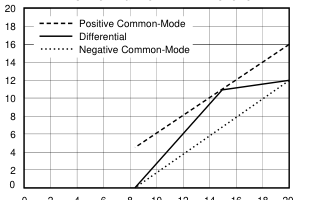
INPUT VOLTAGE FOR LINEAR RESPONSE
3
0 1 2
4 5
0 2
8 10 12 14 16 18 20 4 6 Power Supply Voltage (±VCC)
Time (µs)
Page 6
TYPICAL PERFORMANCE CURVES (CONT)
At TA = +25°C and ±VS = 15VDC, unless otherwise specified.
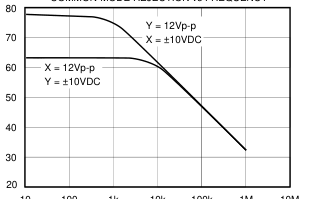
COMMON-MODE REJECTION vs FREQUENCY
1k 10k 100k
10 100
1M 10M
Frequency (Hz)
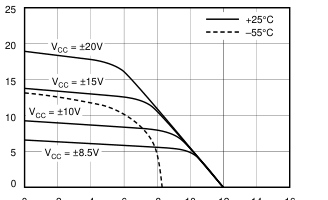
OUTPUT VOLTAGE vs OUTPUT CURRENT
4 6 8
14
0 2
10 12 16
Output Current (±mA)
SUPPLY CURRENT vs AMBIENT TEMPERATURE
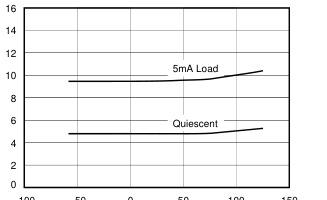
50
–100 –50 0
100 150
Ambient Temperature (°C)
Page 7
THEORY OF OPERATION
The MPY100 is a variable transconductance multiplier consisting of three differential voltage-to-current converters, a multiplier core and an output differential amplifier as illustrated in Figure 1. The basic principle of the transconductance multiplier can be demonstrated by the differential stage in Figure 2. For small values of the input voltage, V1, that are much smaller than VT, the transistor’s thermal voltage, the differential output voltage, VO, is:
VO = gm RLV1
The transconductance gm of the stage is given by:
gm = IE/VT
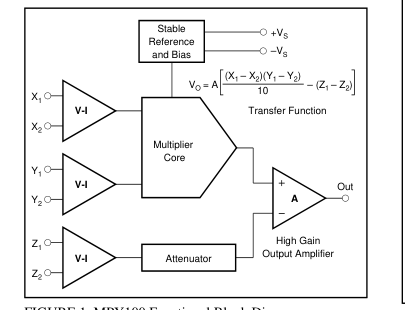
FIGURE 1. MPY100 Functional Block Diagram.
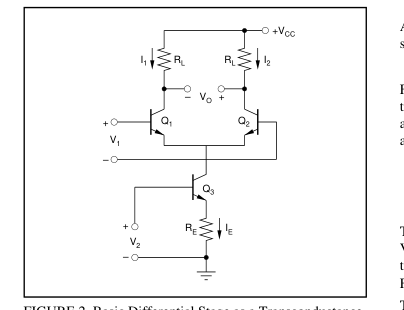
FIGURE 2. Basic Differential Stage as a Transconductance Multiplier.
and is modulated by the voltage, V2, to give
gm ≈ V2/VTRE
Substituting this into the original equation yields the overall transfer function VO = gmRLV1 = V1V2 (RL/VTRE) which shows the output voltage to be the product of the two input voltages, V1 and V2. Variations in IE due to V2 cause a large common-mode voltage swing in the circuit. The errors associated with this common-mode voltage can be eliminated by using two differential stages in parallel and cross-coupling their outputs as shown in Figure 3.
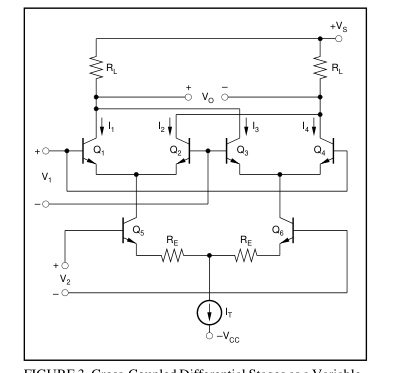
FIGURE 3. Cross-Coupled Differential Stages as a Variable- Transconductance Multiplier.
An analysis of the circuit in Figure 3 shows it to have the same overall transfer function as before:
VO = V1V2 (RL/VTRE).
For input voltages larger than VT, the voltage-to-current transfer characteristics of the differential pair Q1, Q2 or Q3 and Q4 are no longer linear. Instead, their collector currents are related to the applied voltage V1
V1
I1 I3
VT = = e I2 I4
The resultant nonlinearity can be overcome by developing V1 logarithmically to exactly cancel the exponential relationship just derived. This is done by diodes D1 and D2 in Figure 4. The emitter degeneration resistors, RX and RY, in Figure 4, provide a linear conversion of the input voltages to differential current, IX and IY, where:
Page 8
IX = VX/RX and IY = VY/RY
Analysis of Figure 4 shows the voltage VA to be:
VA = (2RL/I1)(IXIY)
Since IX and IY are linearly related to the input voltages VX and VY, VA may also be written:
VA = KVXVY
where K is a scale factor. In the MPY100, K is chosen to be 0.1. The addition of the Z input alters the voltage VA to:
VA = KVXVY – VZ
Therefore, the output of the MPY100 is:
VO = A[KVXVY – VZ]
where A is the open-loop gain of the output amplifier. Writing this last equation in terms of the separate inputs to the MPY100 gives
(X1 – X2)(Y1 – Y2) VO = A – (Z1 – Z2)
10
the transfer function of the MPY100.
WIRING PRECAUTIONS
In order to prevent frequency instability due to lead inductance of the power supply lines, each power supply should be bypassed. This should be done by connecting a 10µF tantalum capacitor in parallel with a 1000pF ceramic capacitor from the +VCC and –VCC pins of the MPY100 to the power supply common. The connection of these capacitors should be as close to the MPY100 as practical.
CAPACITIVE LOADS
Stable operation is maintained with capacitive loads to 1000pF in all modes, except the square root mode for which 50pF is a safe upper limit. Higher capacitive loads can be driven if a 100Ω resistor is connected in series with the MPY100’s output.
DEFINITIONS
TOTAL ERROR (Accuracy) Total error is the actual departure of the multiplier output voltage form the ideal product of its input voltages. It includes the sum of the effects of input and output DC offsets, gain error and nonlinearity.
OUTPUT OFFSET
Output offset is the output voltage when both inputs VX and VY are 0V.
SCALE FACTOR ERROR
Scale factor error is the difference between the actual scale factor and the ideal scale factor.
NONLINEARITY
Nonlinearity is the maximum deviation from a best straightline (curve fitting on input-output graph) expressed as a percent of peak-to-peak full scale output.
FEEDTHROUGH
Feedthrough is the signal at the output for any value of VX or VY within the rated range, when the other input is zero.
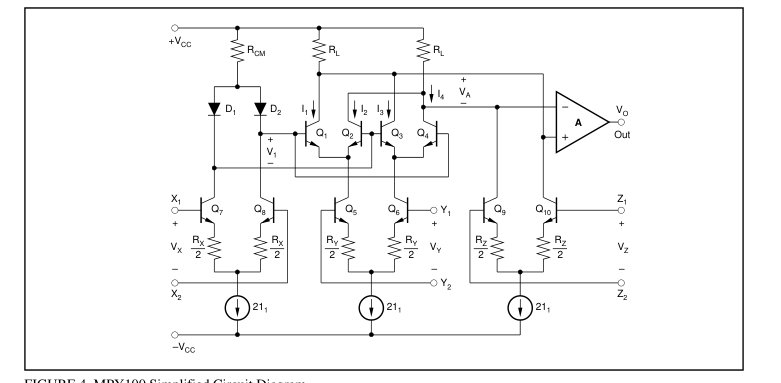
FIGURE 4. MPY100 Simplified Circuit Diagram.
Page 9
SMALL SIGNAL BANDWIDTH
Small signal bandwidth is the frequency at which the output is down 3dB from its low-frequency value for nominal output amplitude of 10% of full scale.
1% AMPLITUDE ERROR
The 1% amplitude error is the frequency the output amplitude is in error by 1%, measured with an output amplitude of 10% of full scale.
1% VECTOR ERROR
The 1% vector error is the frequency at which a phase error of 0.01 radians (0.57°) occurs. This is the most sensitive measure of dynamic error of a multiplier.
TYPICAL APPLICATIONS
MULTIPLICATION
Figure 5 shows the basic connection for four-quadrant multiplication. The MPY100 meets all of its specifications without trimming. Accuracy can, however be improved over a limited range by nulling the output offset voltage using the 100Ω optional balance potentiometer shown in Figure 5. AC feedthrough may be reduced to a minimum by applying an external voltage to the X or Y input as shown in Figure 6. Z2, the optional summing input, may be used to sum a voltage into the output of the MPY100. If not used, this terminal, as well as the X and Y input terminals, should be grounded. All inputs should be referenced to power supply common. Figure 7 shows how to achieve a scale factor larger than the
nominal 1/10. In this case, the scale factor is unity which makes the transfer function
1 + (R1/R2)
VO = KVXVY = K(X1 – X2)(Y1 – Y2).
K = 10 0.1 ≤ K ≤ 1
This circuit has the disadvantage of increasing the output offset voltage by a factor of 10, which may require the use of the optional balance control as in Figure 1 for some applications. In addition, this connection reduces the small signal bandwidth to about 50kHz.
DIVISION
Figure 8 shows the basic connection for two-quadrant division. This configuration is a multiplier-inverted analog divider, i.e., a multiplier connected in the feedback loop of an operational amplifier. In the case of the MPY100, this operational amplifier is the output amplifier shown in Figure 1. The divider error with a multiplier-inverted analog divider is approximately:
εDIVIDER = 10 εMULTIPLIER/(X1 – X2) It is obvious from this error equation that divider error becomes excessively large for small values of X1 – X2. A 10- to-1 denominator range is usually the practical limit. If more accurate division is required over a wide range of denominator voltages, an externally generated voltage may be
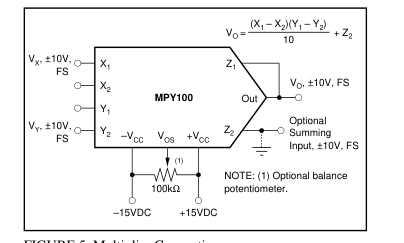
FIGURE 5. Multiplier Connection.
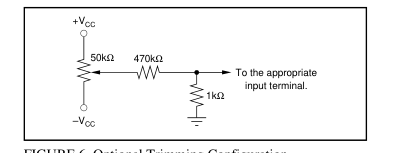
FIGURE 6. Optional Trimming Configuration.
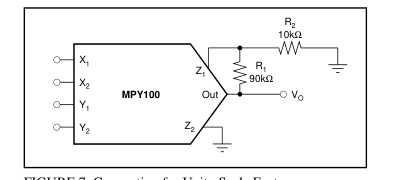
FIGURE 7. Connection for Unity Scale Factor.
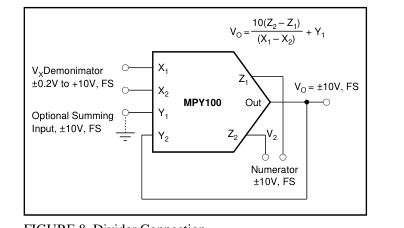
FIGURE 8. Divider Connection.
Page 10
applied to the unused X-input (see Optional Trim Configuration). To trim, apply a ramp of +100mV to +1V at 100Hz to both X1 and Z1 if X2 is used for offset adjustment, otherwise reverse the signal polarity and adjust the trim voltage to minimize the variation in the output. An alternative to this procedure would be to use the Burr-Brown DIV100, a precision log-antilog divider.
SQUARING
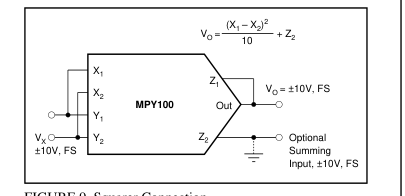
FIGURE 9. Squarer Connection.
SQUARE ROOT
Figure 10 shows the connection for taking the square root of the voltage VZ. The diode prevents a latching condition which could occur if the input momentarily changed polarity. This latching condition is not a design flaw in the MPY100, but occurs when a multiplier is connected in the feedback loop of an operational amplifier to perform square root functions. The load resistance, RL, must be in the range of 10kΩ ≤ RL ≤ 1MΩ. This resistance must be in the circuit as it provides the current necessary to operate the diode.
PERCENTAGE COMPUTATION
The circuit of Figure 11 has a sensitivity of 1V/% and is capable of measuring 10% deviations. Wider deviation can be measured by decreasing the ratio of R2/R1.
BRIDGE LINEARIZATION
The use of the MPY100 to linearize the output from a bridge circuit makes the output VO independent of the bridge supply voltage. See Figure 12.
TRUE RMS-TO-DC CONVERSION
The rms-to-DC conversion circuit of Figure 13 gives greater accuracy and bandwidth but with less dynamic range than most rms-to-DC converters.
SINE FUNCTION GENERATOR
The circuit in Figure 14 uses implicit feedback to implement the following sine function approximation: VO = (1.5715V1 – 0.004317V13)/(1 + 0.001398V12) = 10 sin (9V1)
MORE CIRCUITS
The theory and procedures for developing virtually any function generator or linearization circuit can be found in the Burr-Brown/McGraw Hill book “FUNCTION CIRCUITS - Design and Applications.”
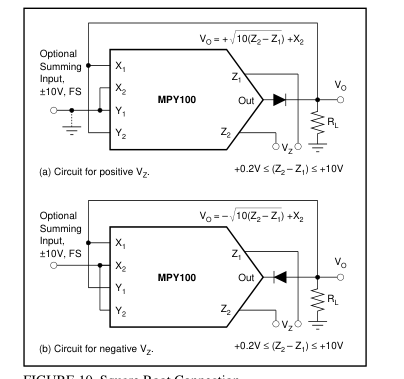
FIGURE 10. Square Root Connection.
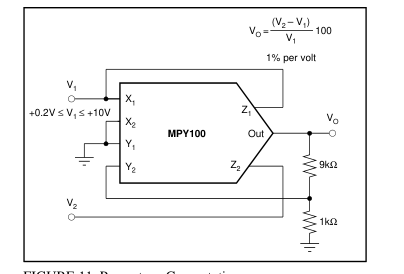
FIGURE 11. Percentage Computation.
Page 11
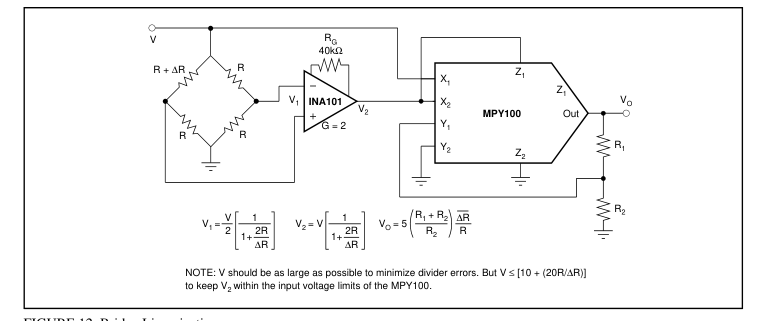
FIGURE 12. Bridge Linearization.
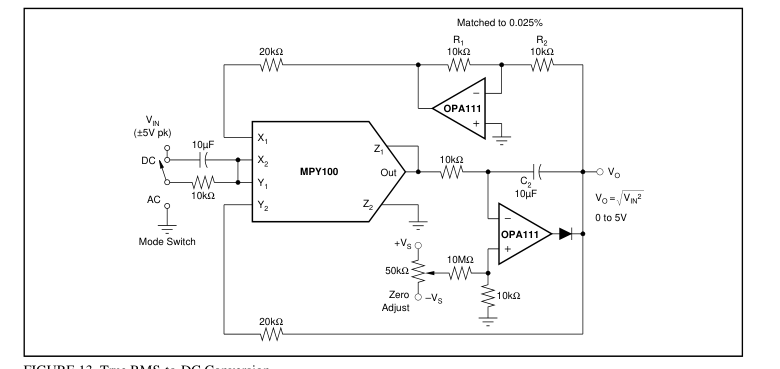
FIGURE 13. True RMS-to-DC Conversion.
Page 12
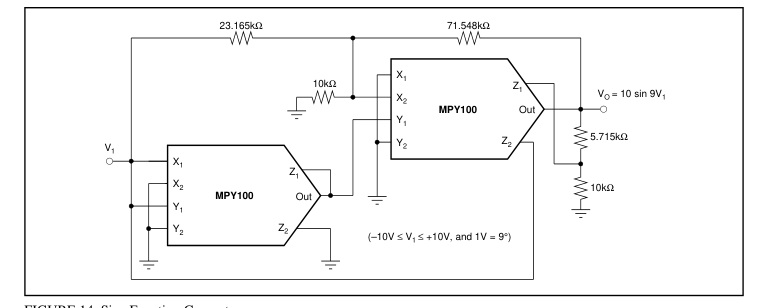
FIGURE 14. Sine Function Generator
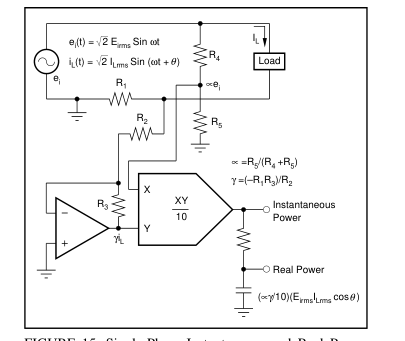
FIGURE 15. Single-Phase Instantaneous and Real Power
Measurement.
The information provided herein is believed to be reliable; however, BURR-BROWN assumes no responsibility for inaccuracies or omissions. BURR-BROWN assumes no responsibility for the use of this information, and all use of such information shall be entirely at the user’s own risk. Prices and specifications are subject to change without notice. No patent rights or licenses to any of the circuits described herein are implied or granted to any third party. BURR-BROWN does not authorize or warrant any BURR-BROWN product for use in life support devices and/or systems.
Page 13
PACKAGE OPTION ADDENDUM
29-Jan-2026
www.ti.com
PACKAGING INFORMATION

(1) Status: For more details on status, see our product life cycle.
(2) Material type: When designated, preproduction parts are prototypes/experimental devices, and are not yet approved or released for full production. Testing and final process, including without limitation quality assurance, reliability performance testing, and/or process qualification, may not yet be complete, and this item is subject to further changes or possible discontinuation. If available for ordering, purchases will be subject to an additional waiver at checkout, and are intended for early internal evaluation purposes only. These items are sold without warranties of any kind.
(3) RoHS values: Yes, No, RoHS Exempt. See the TI RoHS Statement for additional information and value definition.
(4) Lead finish/Ball material: Parts may have multiple material finish options. Finish options are separated by a vertical ruled line. Lead finish/Ball material values may wrap to two lines if the finish value exceeds the maximum column width.
(5) MSL rating/Peak reflow: The moisture sensitivity level ratings and peak solder (reflow) temperatures. In the event that a part has multiple moisture sensitivity ratings, only the lowest level per JEDEC standards is shown. Refer to the shipping label for the actual reflow temperature that will be used to mount the part to the printed circuit board.
(6) Part marking: There may be an additional marking, which relates to the logo, the lot trace code information, or the environmental category of the part.
Multiple part markings will be inside parentheses. Only one part marking contained in parentheses and separated by a "~" will appear on a part. If a line is indented then it is a continuation of the previous line and the two combined represent the entire part marking for that device.
Important Information and Disclaimer:The information provided on this page represents TI's knowledge and belief as of the date that it is provided. TI bases its knowledge and belief on information provided by third parties, and makes no representation or warranty as to the accuracy of such information. Efforts are underway to better integrate information from third parties. TI has taken and continues to take reasonable steps to provide representative and accurate information but may not have conducted destructive testing or chemical analysis on incoming materials and chemicals. TI and TI suppliers consider certain information to be proprietary, and thus CAS numbers
and other limited information may not be available for release.
Addendum-Page 1
Page 14
PACKAGE OPTION ADDENDUM
29-Jan-2026
www.ti.com
In no event shall TI's liability arising out of such information exceed the total purchase price of the TI part(s) at issue in this document sold by TI to Customer on an annual basis.
Addendum-Page 2
Page 15
PACKAGE MATERIALS INFORMATION
www.ti.com
10-Aug-2026
TUBE
T - Tube
height
L - Tube length

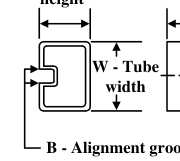
\*All dimensions are nominal
| Device | Package Name | Package Type | Pins | SPQ | L (mm) | W (mm) | T (µm) | B (mm) |
|---|---|---|---|---|---|---|---|---|
| MPY100AG | JD | CDIP SB | 14 | 24 | 506.98 | 15.24 | 12290 | NA |
| MPY100AG.A | JD | CDIP SB | 14 | 24 | 506.98 | 15.24 | 12290 | NA |
| MPY100BG | JD | CDIP SB | 14 | 24 | 506.98 | 15.24 | 12290 | NA |
| MPY100BG.A | JD | CDIP SB | 14 | 24 | 506.98 | 15.24 | 12290 | NA |
| MPY100CG | JD | CDIP SB | 14 | 24 | 506.98 | 15.24 | 12290 | NA |
| MPY100CG.A | JD | CDIP SB | 14 | 24 | 506.98 | 15.24 | 12290 | NA |
Pack Materials-Page 1
Page 16
IMPORTANT NOTICE AND DISCLAIMER
TI PROVIDES TECHNICAL AND RELIABILITY DATA (INCLUDING DATASHEETS), DESIGN RESOURCES (INCLUDING REFERENCE DESIGNS), APPLICATION OR OTHER DESIGN ADVICE, WEB TOOLS, SAFETY INFORMATION, AND OTHER RESOURCES “AS IS” AND WITH ALL FAULTS, AND DISCLAIMS ALL WARRANTIES, EXPRESS AND IMPLIED, INCLUDING WITHOUT LIMITATION ANY IMPLIED WARRANTIES OF MERCHANTABILITY, FITNESS FOR A PARTICULAR PURPOSE OR NON-INFRINGEMENT OF THIRD PARTY INTELLECTUAL PROPERTY RIGHTS. These resources are intended for skilled developers designing with TI products. You are solely responsible for (1) selecting the appropriate TI products for your application, (2) designing, validating and testing your application, and (3) ensuring your application meets applicable
standards, and any other safety, security, regulatory or other requirements. These resources are subject to change without notice. TI grants you permission to use these resources only for development of an application that uses the TI products described in the resource. Other reproduction and display of these resources is prohibited. No license is granted to any other TI intellectual property right or to any third party intellectual property right. TI disclaims responsibility for, and you fully indemnify TI and its representatives against any claims, damages, costs, losses, and liabilities arising out of your use of these resources. TI’s products are provided subject to TI’s Terms of Sale, TI’s General Quality Guidelines, or other applicable terms available either on
ti.com or provided in conjunction with such TI products. TI’s provision of these resources does not expand or otherwise alter TI’s applicable warranties or warranty disclaimers for TI products. Unless TI explicitly designates a product as custom or customer-specified, TI products are standard, catalog, general purpose devices. TI objects to and rejects any additional or different terms you may propose. IMPORTANT NOTICE
Copyright © 2026, Texas Instruments Incorporated
Last updated 10/2025