


 Download PDF
IL300 VISHAY
Document overview
- PDF pages: 15
Technical content
Page 1
Linear Optocoupler, High Gain Stability, Wide Bandwidth
Features
- Couples AC and DC signals
- 0.01 % Servo Linearity
- Wide Bandwidth, > 200 kHz
- High Gain Stability, ± 0.05 %/ °C
- Low Input-Output Capacitance
- Low Power Consumption, < 15 mW
- Isolation Test Voltage, 5300 VRMS, 1.0 sec.
- Internal Insulation Distance, > 0.4 mm for VDE
- Lead-free component
- Component in accordance to RoHS 2002/95/EC
and WEEE 2002/96/EC
Agency Approvals
- UL File #E52744
- DIN EN 60747-5-2 (VDE0884)
DIN EN 60747-5-5 pending Available with Option 1, Add -X001 Suffix
Applications
Power Supply Feedback Voltage/Current Medical Sensor Isolation Audio Signal Interfacing Isolated Process Control Transducers Digital Telephone Isolation
Description
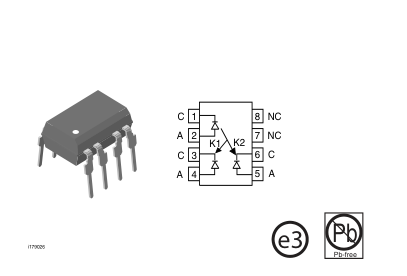
The IL300 Linear Optocoupler consists of an AlGaAs IRLED irradiating an isolated feedback and an output PIN photodiode in a bifurcated arrangement. The feedback photodiode captures a percentage of the
LED’s flux and generates a control signal (IP1) that
can be used to servo the LED drive current. This tech- nique compensates for the LED’s non-linear, time, and temperature characteristics. The output PIN pho- todiode produces an output signal (IP2) that is linearly
related to the servo optical flux created by the LED. The time and temperature stability of the input-output coupler gain (K3) is insured by using matched PIN photodiodes that accurately track the output flux of
the LED.
Document Number 83622 Rev. 1.4, 26-Oct-04
Order Information
| Part | Remarks |
|---|---|
| IL300 | K3 = 0.557 - 1.618, DIP-8 |
| IL300-DEFG | K3 = 0.765 - 1.181, DIP-8 |
| IL300-EF | K3 = 0.851 - 1.061, DIP-8 |
| IL300-E | K3 = 0.851 - 0.955, DIP-8 |
| IL300-F | K3 = 0.945 - 1.061, DIP-8 |
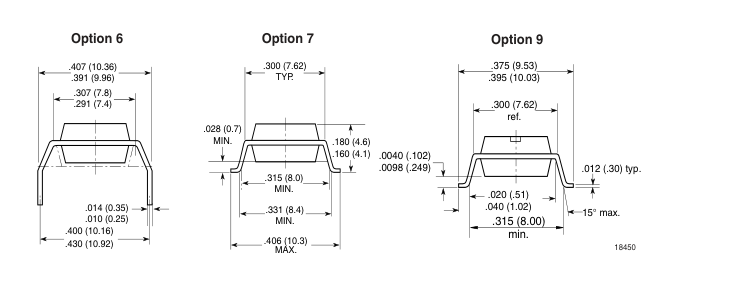
| IL300-X006 | K3 = 0.557 - 1.618, DIP-8 400mil (option 6) |
| IL300-X007 | K3 = 0.557 - 1.618, SMD-8 (option 7) |
| IL300-X009 | K3 = 0.557 - 1.618, SMD-8 (option 9) |
| IL300-DEFG-X006 | K3 = 0.765 - 1.181, DIP-8 400 mil (option 6) |
| IL300-DEFG-X007 | K3 = 0.765 - 1.181, SMD-8 (option 7) |
| IL300-DEFG-X009 | K3 = 0.765 - 1.181, SMD-8 (option 9) |
| IL300-EF-X006 | K3 = 0.851 - 1.061, DIP-8 400 mil (option 6) |
| IL300-EF-X007 | K3 = 0.851 - 1.061, SMD-8 (option 7) |
| IL300-EF-X009 | K3 = 0.851 - 1.061, SMD-8 (option 9) |
| IL300-E-X006 | K3 = 0.851 - 0.955, DIP-8 400 mil (option 6) |
| IL300-E-X007 | K3 = 0.851 - 0.955, SMD-8 (option 7) |
| IL300-E-X009 | K3 = 0.851 - 0.955, SMD-8 (option 9) |
| IL300-F-X006 | K3 = 0.945 - 1.061, DIP-8 400 mil (option 6) |
| IL300-F-X007 | K3 = 0.945 - 1.061, SMD-8 (option 7) |
| IL300-F-X009 | K3 = 0.945 - 1.061, SMD-8 (option 9) |
For additional information on the available options refer to Option Information.
www.vishay.com
Page 2
∆K3-Transfer Gain Linearity
Operation Description
A typical application circuit (Figure 1) uses an opera- The percent deviation of the Transfer Gain, as a functional amplifier at the circuit input to drive the LED. tion of LED or temperature from a specific Transfer The feedback photodiode sources current to R1 con- Gain at a fixed nected to the inverting input of U1. The photocurrent, LED current and temperature. IP1, will be of a magnitude to satisfy the relationship of (IP1 = VIN/R1). The magnitude of this current is directly proportional to the feedback transfer gain (K1) times the LED drive
Photodiode
A silicon diode operating as a current source. The output current is proportional to the incident optical flux
current ( VIN/R1 = K1 • IF). The op-amp will supply supplied by the LED emitter. The diode is operated in LED current to force sufficient photocurrent to keep
the photovoltaic or photoconductive mode. In the pho-
the node voltage (Vb) equal to Va.
tovoltaic mode the diode functions as a current
The output photodiode is connected to a non-invert- source in parallel with a forward biased silicon diode. ing voltage follower amplifier. The photodiode load resistor, R2, performs the current to voltage conversion. The output amplifier voltage is the product of the output forward gain (K2) times the LED current and photodiode load, R2 ( VO = IF • K2 • R2).
The magnitude of the output current and voltage is dependent upon the load resistor and the incident LED optical flux. When operated in the photoconductive mode the diode is connected to a bias supply which reverse biases the silicon diode. The magni-
Therefore, the overall transfer gain (VO/VIN) becomes tude of the output current is directly proportional to the the ratio of the product of the output forward gain (K2) LED incident optical flux. times the photodiode load resistor (R2) to the product of the feedback transfer gain (K1) times the input resistor (R1). This reduces to VO/VIN=(K2 • R2)/(K1 • R1). The overall transfer gain is completely independent of the LED forward current. The IL300 transfer gain (K3) is expressed as the ratio of the output gain (K2) to the feedback gain (K1). This shows that the circuit gain becomes the product of the IL300 transfer gain times the ratio of the output to input resistors
VO/VIN = K3 (R2/R1).
K1-Servo Gain
The ratio of the input photodiode current (IP1) to the LED current (IF) i.e., K1 = IP1/IF.
K2-Forward Gain
The ratio of the output photodiode current (IP2) to the LED current (IF), i.e., K2 = IP2/IF.
K3-Transfer Gain
The Transfer Gain is the ratio of the Forward Gain to the Servo gain, i.e., K3 = K2/K1.
www.vishay.com
LED (Light Emitting Diode)
An infrared emitter constructed of AlGaAs that emits at 890 nm operates efficiently with drive current from 500 µA to 40 mA. Best linearity can be obtained at drive currents between 5.0 mA to 20 mA. Its output flux typically changes by - 0.5 % /°C over the above operational current range.
Application Circuit
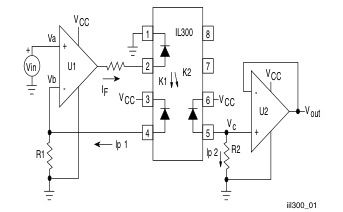
Figure 1. Typical Application Circuit
Document Number 83622 Rev. 1.4, 26-Oct-04
Page 3
Absolute Maximum Ratings
Tamb = 25 °C, unless otherwise specified Stresses in excess of the absolute Maximum Ratings can cause permanent damage to the device. Functional operation of the device is not implied at these or any other conditions in excess of those given in the operational sections of this document. Exposure to absolute Maximum Rating for extended periods of the time can adversely affect reliability.
Input
| Parameter | Test condition | Symbol | Value | Unit |
|---|---|---|---|---|
| Power dissipation | P diss | 160 | mW | |
| Derate linearly from 25 °C | 2.13 | mW/°C | ||
| Forward current | I F | 60 | mA | |
| Surge current (pulse width < 10 µs) | I PK | 250 | mA | |
| Reverse voltage | V R | 5.0 | V | |
| Thermal resistance | R th | 470 | K/W | |
| Junction temperature | T j | 100 | °C |
Output
| Parameter | Test condition | Symbol | Value | Unit |
|---|---|---|---|---|
| Power dissipation | P diss | 50 | mA | |
| Derate linearly from 25 °C | 0.65 | mW/°C | ||
| Reverse voltage | V R | 50 | V | |
| Junction temperature | T j | 100 | °C | |
| Thermal resistance | R th | 1500 | K/W |
Coupler
| Parameter | Test condition | Symbol | Value | Unit |
|---|---|---|---|---|
| Total package dissipation at 25 °C | P tot | 210 | mW | |
| Derate linearly from 25 °C | 2.8 | mW/°C | ||
| Storage temperature | T stg | - 55 to + 150 | °C | |
| Operating temperature | T amb | - 55 to + 100 | °C | |
| Isolation test voltage | > 5300 | V RMS | ||
| Isolation resistance | V = 500 V, T = 25 °C IO amb | R IO | > 1012 | Ω |
| V = 500 V, T = 100 °C IO amb | R IO | > 1011 | Ω |
Document Number 83622
www.vishay.com
Rev. 1.4, 26-Oct-04
Page 4
Electrical Characteristics
Tamb = 25 °C, unless otherwise specified Minimum and maximum values are testing requirements. Typical values are characteristics of the device and are the result of engineering evaluation. Typical values are for information only and are not part of the testing requirements.
Input
LED Emitter
| Parameter | Test condition | Symbol | Min | Typ. | Max | Unit |
|---|---|---|---|---|---|---|
| Forward voltage | I = 10 mA F | V F | 1.25 | 1.50 | V | |
| V Temperature coefficient F | ∆V /∆°C F | - 2.2 | mV/°C | |||
| Reverse current | V = 5 V R | I R | 1.0 | µA | ||
| Junction capacitance | V = 0 V, f = 1.0 MHz F | C j | 15 | pF | ||
| Dynamic resistance | I = 10 mA F | ∆V /∆I F F | 6.0 | Ω |
Output
| Parameter | Test condition | Symbol | Min | Typ. | Max | Unit |
|---|---|---|---|---|---|---|
| Dark current | V = -15 V, I = 0 µs det F | I D | 1.0 | 25 | nA | |
| Open circuit voltage | I = 10 mA F | V D | 500 | mV | ||
| Short circuit current | I = 10 mA F | I SC | 70 | µA | ||
| Junction capacitance | V = 0, f = 1.0 MHz F | C j | 12 | pF | ||
| Noise equivalent power | V = 15 V det | NEP | 4 x 10¹⁴ | W/√Hz |
www.vishay.com
Document Number 83622 Rev. 1.4, 26-Oct-04
Page 5
Coupler
| Parameter | Test condition | Symbol | Min | Typ. | Max | Unit |
|---|---|---|---|---|---|---|
| Input- output capacitance | V = 0 V, f = 1.0 MHz F | 1.0 | pF | |||
| K1, Servo gain (I /I ) P1 F | I = 10 mA, V = - 15 V F det | K1 | 0.0050 | 0.007 | 0.011 | |
| Servo current, see Note 1,2 | I = 10 mA, V = - 15 V F det | I P1 | 70 | µA | ||
| K2, Forward gain (I /I ) P2 F | I = 10 mA, V = - 15 V F det | K2 | 0.0036 | 0.007 | 0.011 | |
| Forward current | I = 10 mA, V = - 15 V F det | I P2 | 70 | µA | ||
| K3, Transfer gain (K2/K1) see Note 1,2 | I = 10 mA, V = - 15 V F det | K3 | 0.56 | 1.00 | 1.65 | K2/K1 |
| Transfer gain linearity | I = 1.0 to 10 mA F | ∆K3 | ± 0.25 | % | ||
| I = 1.0 to 10 mA, F T = 0 °C to 75 °C amb | ± 0.5 | % | ||||
| Photoconductive Operation | ||||||
| Frequency response | I = 10 mA, MOD = ± 4.0 mA, Fq R = 50 Ω L | BW (-3 db) | 200 | KHz | ||
| Phase response at 200 kHz | V = - 15 V det | -45 | Deg. |
- Bin Sorting:
K3 (transfer gain) is sorted into bins that are ± 6 % , as follows: Bin A = 0.557 - 0.626 Bin B = 0.620 - 0.696
Bin C = 0.690 - 0.773 Bin D = 0.765 - 0.859 Bin E = 0.851 - 0.955
Bin F = 0.945 - 1.061 Bin G = 1.051 - 1.181 Bin H = 1.169 - 1.311
Bin I = 1.297 - 1.456 Bin J = 1.442 - 1.618 K3 = K2/K1. K3 is tested at IF = 10 mA, Vdet = - 15 V. 2. Bin Categories: All IL300s are sorted into a K3 bin, indicated by an alpha character that is marked on the part. The bins range from "A" through "J".
The IL300 is shipped in tubes of 50 each. Each tube contains only one category of K3. The category of the parts in the tube is marked on the tube label as well as on each individual part.
- Category Options: Standard IL300 orders will be shipped from the categories that are available at the time of the order. Any of the ten categories may be shipped. For customers requiring a narrower selection of bins, four different bin option parts are offered.
IL300-DEFG: Order this part number to receive categories D,E,F,G only. IL300-EF: Order this part number to receive categories E, F only.
IL300-E: Order this part number to receive category E only.
Switching Characteristics
| Parameter | Test condition | Symbol | Min | Typ. | Max | Unit |
|---|---|---|---|---|---|---|
| Switching time | ∆I = 2.0 mA, I = 10 mA F Fq | t r | 1.0 | µs | ||
| t f | 1.0 | µs | ||||
| Rise time | t r | 1.75 | µs | |||
| Fall time | t f | 1.75 | µs |
Document Number 83622
www.vishay.com
Rev. 1.4, 26-Oct-04
Page 6
Common Mode Transient Immunity
| Parameter | Test condition | Symbol | Min | Typ. | Max | Unit |
|---|---|---|---|---|---|---|
| Common mode capacitance | V = 0, f = 1. MHz F | C CM | 0.5 | pF | ||
| Common mode rejection ratio | f = 60 Hz, R = 2.2 KΩ L | CMRR | 130 | dB |
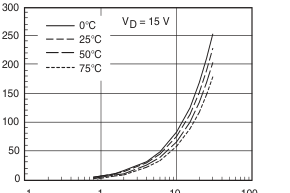
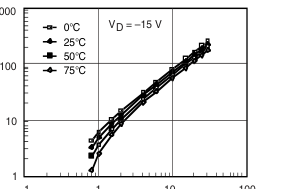
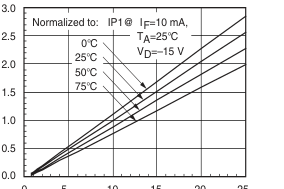
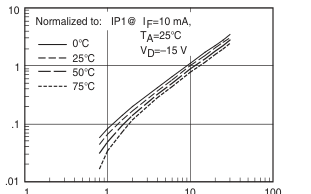
Typical Characteristics (Tamb = 25 °C unless otherwise specified)
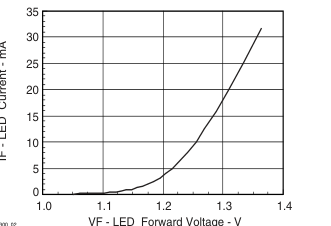
iil300_02
Figure 2. LED Forward Current vs.Forward Voltage
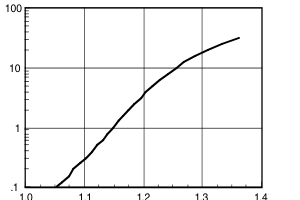
VF - LED Forward Voltage - V
iil300_03
Figure 3. LED Forward Current vs.Forward Voltage
www.vishay.com
.1 1 10 100
IF - LED Current - mA
iil300_04
Figure 4. Servo Photocurrent vs. LED Current and Temperature
.1 1 10 100
IF - LED Current - mA
iil300_05
Figure 5. Servo Photocurrent vs. LED Current and Temperature
Document Number 83622 Rev. 1.4, 26-Oct-04
Page 7
0 5 10 15 20 25
IF - LED Current - mA
iil300_06
Figure 6. Normalized Servo Photocurrent vs. LED Current and
Temperature
IF - LED Current - mA
iil300_07
Figure 7. Normalized Servo Photocurrent vs. LED Current and
Temperature
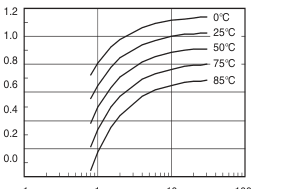
.1 1 10 100
IF - LED Current - mA
iil300_08
Figure 8. Servo Gain vs. LED Current and Temperature
Document Number 83622 Rev. 1.4, 26-Oct-04
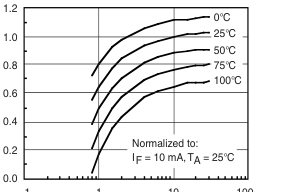
.1 1 10 100
IF - LED Current - mA
iil300_09
Figure 9. Normalized Servo Gain vs. LED Current and
Temperature
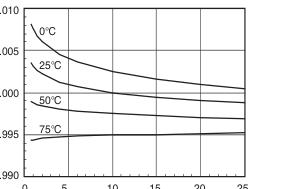
0 5 10 15 20 25
IF - LED Current - mA
iil300_10
Figure 10. Transfer Gain vs. LED Current and Temperature
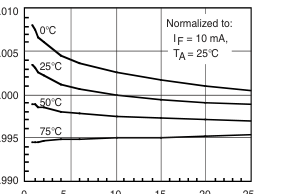
0 5 10 15 20 25
IF - LED Current - mA
iil300_11
Figure 11. Normalized Transfer Gain vs. LED Current and
Temperature
www.vishay.com
Page 8
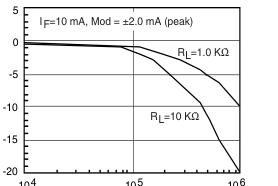
104
105
106
F - Frequency - Hz
iil300_12
Figure 12. Amplitude Response vs. Frequency
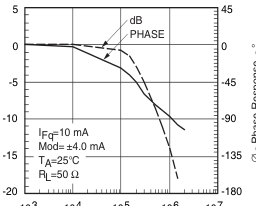
103 104 105 106 107
F - Frequency - Hz
iil300_13
Figure 13. Amplitude and Phase Response vs. Frequency
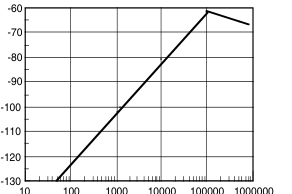
F - Frequency - Hz
iil300_14
Figure 14. Common-Mode Rejection
www.vishay.com
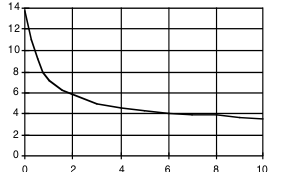
Voltage - Vdet
iil300_15
Figure 15. Photodiode Junction Capacitance vs. Reverse Voltage
Application Considerations
In applications such as monitoring the output voltage from a line powered switch mode power supply, measuring bioelectric signals, interfacing to industrial transducers, or making floating current measurements, a galvanically isolated, DC coupled interface is often essential. The IL300 can be used to construct an amplifier that will meet these needs. The IL300 eliminates the problems of gain nonlinearity and drift induced by time and temperature, by monitoring LED output flux. A PIN photodiode on the input side is optically coupled to the LED and produces a current directly proportional to flux falling on it. This photocurrent, when coupled to an amplifier, provides the servo signal that
controls the LED drive current. The LED flux is also coupled to an output PIN photodiode. The output photodiode current can be directly or amplified to satisfy the needs of succeeding circuits.
Isolated Feedback Amplifier
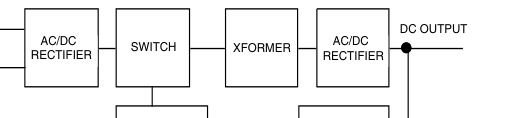
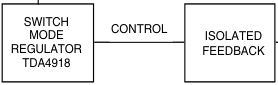
The IL300 was designed to be the central element of DC coupled isolation amplifiers. Designing the IL300 into an amplifier that provides a feedback control signal for a line powered switch mode power is quite simple, as the following example will illustrate. See Figure 17 for the basic structure of the switch mode supply using the Infineon TDA4918 Push-Pull Switched Power Supply Control Chip. Line isolation and insulation is provided by the high frequency transformer. The voltage monitor isolation will be provided by the IL300.
Document Number 83622 Rev. 1.4, 26-Oct-04
Page 9
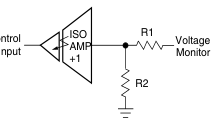
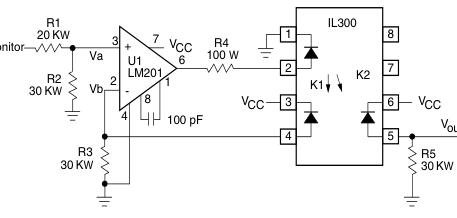
The isolated amplifier provides the PWM control signal which is derived from the output supply voltage. Figure 16 more closely shows the basic function of the amplifier. The control amplifier consists of a voltage divider and a non-inverting unity gain stage. The TDA4918 data sheet indicates that an input to the control amplifier is a high quality operational amplifier that typically requires a +3.0 V signal. Given this information, the amplifier circuit topology shown in Figure 18 is selected. The power supply voltage is scaled by R1 and R2 so that there is + 3.0 V at the non-inverting input (Va) of U1. This voltage is offset by the voltage developed by photocurrent flowing through R3. This photocurrent is
developed by the optical flux created by current flowing through the LED. Thus as the scaled monitor voltage (Va) varies it will cause a change in the LED current necessary to satisfy the differential voltage needed across R3 at the inverting input. The first step in the design procedure is to select the value of R3 given the LED quiescent current (IFq) and the servo gain (K1). For this design, IFq = 12 mA. Figure 4 shows the servo photocurrent at IFq is found to be 100 µA. With this data R3 can be calculated.
R3 = Vb
3 V = 30 KΩ = 100 µA IPI
17164
To Control
iil300_16
Figure 16. Isolated Control Amplifier
For best input offset compensation at U1, R2 will equal R3. The value of R1 can easily be calculated from the following.
R1 = R2( VMONITOR - 1)
Va
17165
Document Number 83622 Rev. 1.4, 26-Oct-04
The value of R5 depends upon the IL300 Transfer Gain (K3). K3 is targeted to be a unit gain device, however to minimize the part to part Transfer Gain variation, Infineon offers K3 graded into ± 5 % bins. R5 can determined using the following equation,
VOUT
- R3(R1 + R2)
R5 =
R2K3
VMONITOR
17166
Or if a unity gain amplifier is being designed (VMON- ITOR = VOUT, R1 = 0), the equation simplifies to:
R3 R5 = K3
17190
www.vishay.com
Page 10
1 1 0 / 220 MAIN
iil300_17
Figure 17. Switching Mode Power Supply
Vmonitor
To control input
iil300_18
Figure 18. DC Coupled Power Supply Feedback Amplifier
Table 1. gives the value of R5 given the production K3 bins.
R5 Selection
Table 1.
| Bins | Min. | Max. | 3 Typ. | R5 Resistor KΩ | 1% KΩ |
|---|---|---|---|---|---|
| A | 0.560 | 0.623 | 0.59 | 50.85 | 51.1 |
| B | 0.623 | 0.693 | 0.66 | 45.45 | 45.3 |
| C | 0.693 | 0.769 | 0.73 | 41.1 | 41.2 |
| D | 0.769 | 0.855 | 0.81 | 37.04 | 37.4 |
| E | 0.855 | 0.950 | 0.93 | 32.26 | 32.4 |
| F | 0.950 | 1.056 | 1.00 | 30.00 | 30.0 |
| G | 1.056 | 1.175 | 1.11 | 27.03 | 27.0 |
| H | 1.175 | 1.304 | 1.24 | 24.19 | 24.0 |
| I | 1.304 | 1.449 | 1.37 | 21.90 | 22.0 |
| J | 1.449 | 1.610 | 1.53 | 19.61 | 19.4 |
www.vishay.com
Document Number 83622 Rev. 1.4, 26-Oct-04
Page 11
The last step in the design is selecting the LED current limiting resistor (R4). The output of the operational amplifier is targeted to be 50 % of the VCC, or 2.5 V. With an LED quiescent current of 12 mA the typical LED (VF) is 1.3 V. Given this and the operational output voltage, R4 can be calculated.
Vopamp - VF = 2.5 V - 1.3 V = 100Ω
R4 =
12 mA
IFq
17096
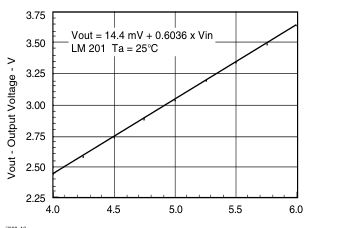
The circuit was constructed with an LM201 differential operational amplifier using the resistors selected. The amplifier was compensated with a 100 pF capacitor connected between pins 1 and 8. The DC transfer characteristics are shown in Figure 19. The amplifier was designed to have a gain of 0.6 and was measured to be 0.6036. Greater accuracy can be achieved by adding a balancing circuit, and potentiometer in the input divider, or at R5. The circuit shows exceptionally good gain linearity with an RMS error of only 0.0133 % over the input voltage range of 4.0 V - 6.0 V in a servo mode; see Figure 20.
iil300_19
Figure 19. Transfer Gain
Document Number 83622 Rev. 1.4, 26-Oct-04
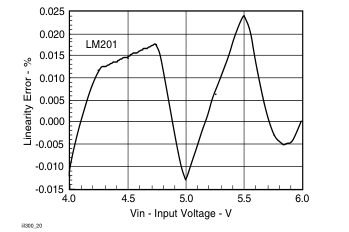
Figure 20. Linearity Error vs. Input Voltage
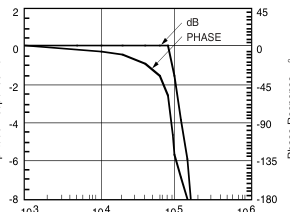
The AC characteristics are also quite impressive offering a - 3.0 dB bandwidth of 100 kHz, with a -45 ° phase shift at 80 kHz as shown in Figure 21.
103 104 105 106
F - Frequency - Hz
iil300_21
Figure 21. Amplitude and Phase Power Supply Control
The same procedure can be used to design isolation amplifiers that accept bipolar signals referenced to ground. These amplifiers circuit configurations are shown in Figure 22. In order for the amplifier to respond to a signal that swings above and below ground, the LED must be pre biased from a separate source by using a voltage reference source (Vref1). In these designs, R3 can be determined by the following equation.
R3 = Vref1 = Vref1 IP1 K1IFq
17098
www.vishay.com
Page 12
| Non-Inverting Input –Vcc Vin 3+ 7 Vcc 1 IL 100 Ω 6 R1 R2 2 2 – –Vcc +Vcc 3 4 20pF 4 R3 –Vref1 | Non-Inverting Output +Vref2 R5 300 8 R6 7 2 – 7 Vcc Vcc 6 6 Vo 3+ 4–Vcc 5 R4 |
| Inverting Input Vin 7 3+ Vcc 100 Ω R1 6 1 IL R2 2 Vcc +Vcc – 2 4 20pF 3 R3 4 –Vcc +Vref1 iil300_22 | Inverting Output +Vref2 300 8 3+ 7 7 Vcc Vcc 6 6 Vout 5 2 – –Vcc 4 R4 |
Figure 22. Non-inverting and Inverting Amplifiers
Table 2. Optolinear amplifiers
| Amplifier | Input | Output | Gain | Offset |
| Non-Inverting | Inverting | Inverting | VOUT K3 R4 R2 = VIN R3 (R1 + R2) | Vref1 R4 K3 Vref2 = R3 |
| Non-Inverting | Non-Inverting | VOUT K3 R4 R2 (R5 + R6) = VIN R3 R5 (R1 + R2) | - Vref1R4 (R5 + R6) K3 Vref2 = R3 R6 | |
| nverting | Inverting | Non-Inverting | VOUT - K3 R4 R2 (R5 + R6) = VIN R3 R5 (R1 + R2) | Vref1R4 (R5 + R6) K3 Vref2 = R3 R6 |
| Non-Inverting | Inverting | VOUT - K3 R4 R2 = VIN R3 (R1 + R2) | - Vref1 R4 K3 Vref2 = R3 |
17189
These amplifiers provide either an inverting or non- age output for a zero voltage input. The non-inverting inverting transfer gain based upon the type of input input amplifier requires the use of a bipolar supply,
and output amplifier. Table 2 shows the various con- while the inverting input stage can be implemented figurations along with the specific transfer gain equa- with single supply operational amplifiers that permit
tions. The offset column refers to the calculation of the operation close to ground. output offset or Vref2 necessary to provide a zero volt-
www.vishay.com
Document Number 83622 Rev. 1.4, 26-Oct-04
Page 13
For best results, place a buffer transistor between the LED and output of the operational amplifier when a CMOS opamp is used or the LED IFq drive is targeted
to operate beyond 15 mA. Finally the bandwidth is
Package Dimensions in Inches (mm)
influenced by the magnitude of the closed loop gain of the input and output amplifiers. Best bandwidths result when the amplifier gain is designed for unity.
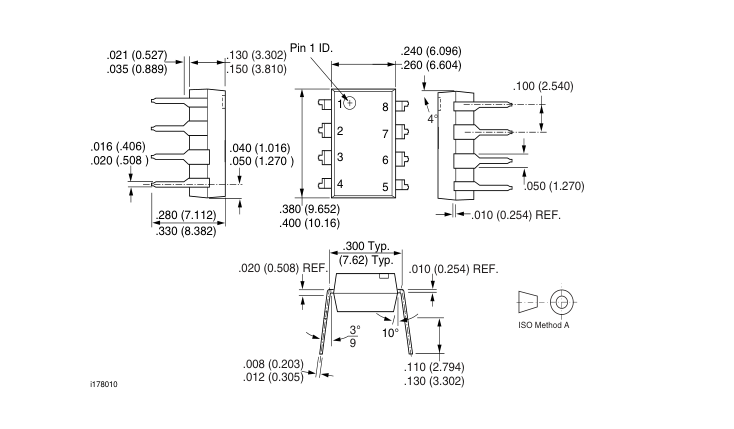
Document Number 83622
www.vishay.com
Rev. 1.4, 26-Oct-04
Page 14
Ozone Depleting Substances Policy Statement
It is the policy of Vishay Semiconductor GmbH to 1. Meet all present and future national and international statutory requirements. 2. Regularly and continuously improve the performance of our products, processes, distribution and operatingsystems with respect to their impact on the health and safety of our employees and the public, as well as their impact on the environment. It is particular concern to control or eliminate releases of those substances into the atmosphere which are known as ozone depleting substances (ODSs). The Montreal Protocol (1987) and its London Amendments (1990) intend to severely restrict the use of ODSs and forbid their use within the next ten years. Various national and international initiatives are pressing for an
earlier ban on these substances. Vishay Semiconductor GmbH has been able to use its policy of continuous improvements to eliminate the use of ODSs listed in the following documents. 1. Annex A, B and list of transitional substances of the Montreal Protocol and the London Amendments respectively 2. Class I and II ozone depleting substances in the Clean Air Act Amendments of 1990 by the Environmental Protection Agency (EPA) in the USA 3. Council Decision 88/540/EEC and 91/690/EEC Annex A, B and C (transitional substances) respectively. Vishay Semiconductor GmbH can certify that our semiconductors are not manufactured with ozone depleting substances and do not contain such substances.
We reserve the right to make changes to improve technical design
and may do so without further notice.
Parameters can vary in different applications. All operating parameters must be validated for each customer application by the customer. Should the buyer use Vishay Semiconductors products for any unintended or unauthorized application, the buyer shall indemnify Vishay Semiconductors against all claims, costs, damages, and expenses, arising out of, directly or indirectly, any claim of personal damage, injury or death associated with such unintended or unauthorized use.
Vishay Semiconductor GmbH, P.O.B. 3535, D-74025 Heilbronn, Germany Telephone: 49 (0)7131 67 2831, Fax number: 49 (0)7131 67 2423
www.vishay.com
Document Number 83622 Rev. 1.4, 26-Oct-04
Page 15
Document Number 83622
www.vishay.com
Rev. 1.4, 26-Oct-04