


 Download PDF
HGTG12N60A4D FAIRCHILD
Document overview
- PDF pages: 8
Technical content
Page 1
Data Sheet
600V, SMPS Series N-Channel IGBT with
Anti-Parallel Hyperfast Diode
The HGTG12N60A4D, HGTP12N60A4D and HGT1S12N60A4DS are MOS gated high voltage switching devices combining the best features of MOSFETs and bipolar transistors. These devices have the high input impedance of a MOSFET and the low on-state conduction loss of a bipolar transistor. The much lower on-state voltage drop varies only moderately between 25oC and 150oC. The IGBT used is the development type TA49335. The diode used in anti-parallel is the development type TA49371.
This IGBT is ideal for many high voltage switching applications operating at high frequencies where low conduction losses are essential. This device has been optimized for high frequency switch mode power supplies.
Formerly Developmental Type TA49337.
Ordering Information
| PART NUMBER | PACKAGE | BRAND |
|---|---|---|
| HGTG12N60A4D | TO-247 | 12N60A4D |
| HGTP12N60A4D | TO-220AB | 12N60A4D |
| HGT1S12N60A4DS | TO-263AB | 12N60A4D |
NOTE: When ordering, use the entire part number. Add the suffix 9A to obtain the TO-263AB variant in tape and reel, e.g. HGT1S12N60A4DS9A.
Symbol
C
G
E
HGTG12N60A4D, HGTP12N60A4D,
HGT1S12N60A4DS
December 2001
Features
- >100kHz Operation . . . . . . . . . . . . . . . . . . . . . 390V, 12A
- 200kHz Operation . . . . . . . . . . . . . . . . . . . . . . . 390V, 9A
- 600V Switching SOA Capability
- Typical Fall Time. . . . . . . . . . . . . . . . . 70ns at TJ = 125oC
- Low Conduction Loss
- Temperature Compensating SABER™ Model www.fairchildsermi.com
- Related Literature - TB334 “Guidelines for Soldering Surface Mount Components to PC Boards
Packaging
JEDEC TO-220AB ALTERNATE VERSION
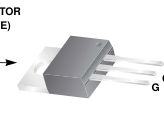
COLLECTOR
(FLANGE)
E C
JEDEC TO-263AB
COLLECTOR
(FLANGE)
G
E
JEDEC STYLE TO-247
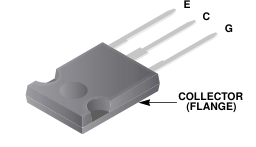
Fairchild CORPORATION IGBT PRODUCT IS COVERED BY ONE OR MORE OF THE FOLLOWING U.S. PATENTS
4,364,073
4,417,385
4,430,792
4,443,931
4,466,176
4,516,143
4,532,534
4,587,713
4,598,461
4,605,948
4,620,211
4,631,564
4,639,754
4,639,762
4,641,162
4,644,637
4,682,195
4,684,413
4,694,313
4,717,679
4,743,952
4,783,690
4,794,432
4,801,986
4,803,533
4,809,045
4,809,047
4,810,665
4,823,176
4,837,606
4,860,080
4,883,767
4,888,627
4,890,143
4,901,127
4,904,609
4,933,740
4,963,951
4,969,027
Page 2
Absolute Maximum Ratings TC = 25oC, Unless Otherwise Specified
Collector to Emitter Voltage . . . . . . . . . . . . . . . . . . . . . . . . . . . . . . . . . . . . . . . . . . . . . . BVCES Collector Current Continuous At TC = 25oC . . . . . . . . . . . . . . . . . . . . . . . . . . . . . . . . . . . . . . . . . . . . . . . . . . . . . . . . . IC25 At TC = 110oC . . . . . . . . . . . . . . . . . . . . . . . . . . . . . . . . . . . . . . . . . . . . . . . . . . . . . . . IC110 Collector Current Pulsed (Note 1) . . . . . . . . . . . . . . . . . . . . . . . . . . . . . . . . . . . . . . . . . . . ICM Gate to Emitter Voltage Continuous. . . . . . . . . . . . . . . . . . . . . . . . . . . . . . . . . . . . . . . . . VGES
Gate to Emitter Voltage Pulsed . . . . . . . . . . . . . . . . . . . . . . . . . . . . . . . . . . . . . . . . . . . . VGEM Switching Safe Operating Area at TJ = 150oC, Figure 2 . . . . . . . . . . . . . . . . . . . . . . . . SSOA Power Dissipation Total at TC = 25oC . . . . . . . . . . . . . . . . . . . . . . . . . . . . . . . . . . . . . . . . . PD Power Dissipation Derating TC > 25oC . . . . . . . . . . . . . . . . . . . . . . . . . . . . . . . . . . . . . . . . . . Operating and Storage Junction Temperature Range . . . . . . . . . . . . . . . . . . . . . . . . TJ, TSTG Maximum Temperature for Soldering Leads at 0.063in (1.6mm) from Case for 10s. . . . . . . . . . . . . . . . . . . . . . . . . . . . . . . . . . TL
Package Body for 10s, see Tech Brief 334. . . . . . . . . . . . . . . . . . . . . . . . . . . . . . . . . . . Tpkg
HGTG12N60A4D,
HGTP12N60A4D,
HGT1S12N60A4DS
UNITS
600
V
54
A
23
A
96
A
±20
V
±30
V
60A at 600V 167
W W/oC
1.33
oC
-55 to 150
oC
300
oC
260
CAUTION: Stresses above those listed in “Absolute Maximum Ratings” may cause permanent damage to the device. This is a stress only rating and operation of the device at these or any other conditions above those indicated in the operational sections of this specification is not implied.
NOTE: 1. Pulse width limited by maximum junction temperature.
Electrical Specifications TJ = 25oC, Unless Otherwise Specified
| PARAMETER | SYMBOL | TEST CONDITIONS | MIN | TYP | MAX | UNITS | |
|---|---|---|---|---|---|---|---|
| Collector to Emitter Breakdown Voltage | BVCES | IC = 250µA, VGE = 0V | 600 | - | - | V | |
| Collector to Emitter Leakage Current | ICES | VCE = 600V | TJ = 25oC | - | - | 250 | µA |
| TJ = 125oC | - | - | 2.0 | mA | |||
| Collector to Emitter Saturation Voltage | VCE(SAT) | IC = 12A, VGE = 15V | TJ = 25oC | - | 2.0 | 2.7 | V |
| TJ = 125oC | - | 1.6 | 2.0 | V | |||
| Gate to Emitter Threshold Voltage | VGE(TH) | IC = 250µA, VCE = 600V | - | 5.6 | - | V | |
| Gate to Emitter Leakage Current | IGES | VGE = ±20V | - | - | ±250 | nA | |
| Switching SOA | SSOA | TJ = 150oC, RG = 10Ω, VGE = 15V, L = 100µH, VCE = 600V | 60 | - | - | A | |
| Gate to Emitter Plateau Voltage | VGEP | IC = 12A, VCE = 300V | - | 8 | - | V | |
| On-State Gate Charge | Qg(ON) | IC = 12A, VCE = 300V | VGE = 15V | - | 78 | 96 | nC |
| VGE = 20V | - | 97 | 120 | nC | |||
| Current Turn-On Delay Time | td(ON)I | IGBT and Diode at TJ = 25oC, ICE = 12A, VCE = 390V, VGE = 15V, RG = 10Ω, L = 500µH, Test Circuit (Figure 24) | - | 17 | - | ns | |
| Current Rise Time | trI | - | 8 | - | ns | ||
| Current Turn-Off Delay Time | td(OFF)I | - | 96 | - | ns | ||
| Current Fall Time | tfI | - | 18 | - | ns | ||
| Turn-On Energy (Note 3) | EON1 | - | 55 | - | µJ | ||
| Turn-On Energy (Note 3) | EON2 | - | 160 | - | µJ | ||
| Turn-Off Energy (Note 2) | EOFF | - | 50 | - | µJ | ||
| Current Turn-On Delay Time | td(ON)I | IGBT and Diode at TJ = 125oC, ICE = 12A, VCE = 390V, VGE = 15V, RG = 10Ω, L = 500µH, Test Circuit (Figure 24) | - | 17 | - | ns | |
| Current Rise Time | trI | - | 16 | - | ns | ||
| Current Turn-Off Delay Time | td(OFF)I | - | 110 | 170 | ns | ||
| Current Fall Time | tfI | - | 70 | 95 | ns | ||
| Turn-On Energy (Note3) | EON1 | - | 55 | - | µJ | ||
| Turn-On Energy (Note 3) | EON2 | - | 250 | 350 | µJ | ||
| Turn-Off Energy (Note 2) | EOFF | - | 175 | 285 | µJ | ||
Page 3
Electrical Specifications TJ = 25oC, Unless Otherwise Specified (Continued)
| PARAMETER | SYMBOL | TEST CONDITIONS | MIN | TYP | MAX | UNITS |
|---|---|---|---|---|---|---|
| Diode Forward Voltage | VEC | IEC = 12A | - | 2.2 | - | V |
| Diode Reverse Recovery Time | trr | IEC = 12A, dIEC/dt = 200A/µs | - | 30 | - | ns |
| IEC = 1A, dIEC/dt = 200A/µs | - | 18 | - | ns | ||
| Thermal Resistance Junction To Case | RθJC | IGBT | - | - | 0.75 | oC/W |
| Diode | - | - | 2.0 | oC/W |
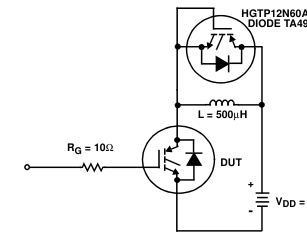
NOTES: 2. Turn-Off Energy Loss (EOFF) is defined as the integral of the instantaneous power loss starting at the trailing edge of the input pulse and ending at the point where the collector current equals zero (ICE = 0A). All devices were tested per JEDEC Standard No. 24-1 Method for Measurement of Power Device Turn-Off Switching Loss. This test method produces the true total Turn-Off Energy Loss. 3. Values for two Turn-On loss conditions are shown for the convenience of the circuit designer. EON1 is the turn-on loss of the IGBT only. EON2 is the turn-on loss when a typical diode is used in the test circuit and the diode is at the same TJ as the IGBT. The diode type is specified in
Figure 24.
Typical Performance Curves Unless Otherwise Specified
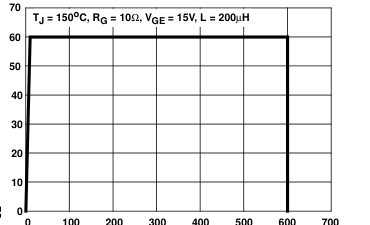
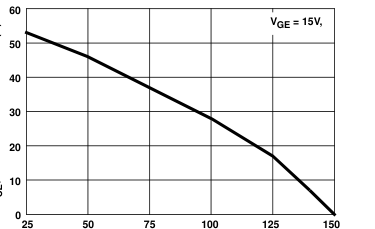
100 200 300 400 500 600
0
700
TC, CASE TEMPERATURE (oC)
VCE, COLLECTOR TO EMITTER VOLTAGE (V)
FIGURE 2. MINIMUM SWITCHING SAFE OPERATING AREA
FIGURE 1. DC COLLECTOR CURRENT vs CASE
TEMPERATURE
VGE, GATE TO EMITTER VOLTAGE (V)
ICE, COLLECTOR TO EMITTER CURRENT (A)
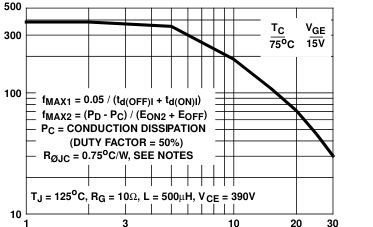
FIGURE 3. OPERATING FREQUENCY vs COLLECTOR TO
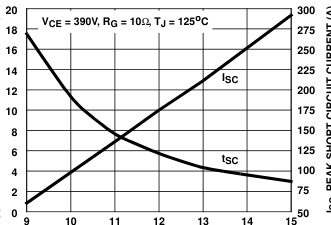
FIGURE 4. SHORT CIRCUIT WITHSTAND TIME
EMITTER CURRENT
Page 4
VCE, COLLECTOR TO EMITTER VOLTAGE (V)
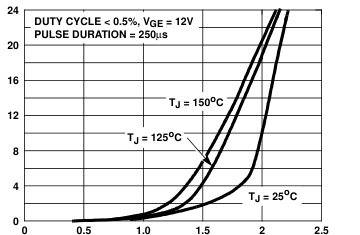
FIGURE 5. COLLECTOR TO EMITTER ON-STATE VOLTAGE
ICE , COLLECTOR TO EMITTER CURRENT (A)
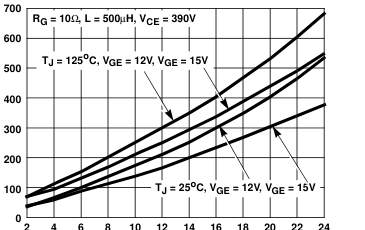
FIGURE 7. TURN-ON ENERGY LOSS vs COLLECTOR TO
EMITTER CURRENT
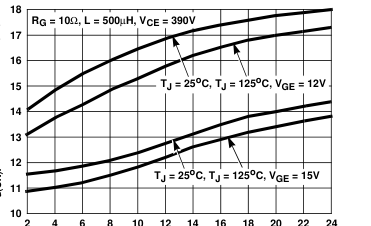
ICE, COLLECTOR TO EMITTER CURRENT (A)
FIGURE 9. TURN-ON DELAY TIME vs COLLECTOR TO
EMITTER CURRENT
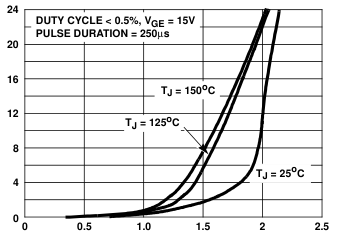
VCE, COLLECTOR TO EMITTER VOLTAGE (V)
FIGURE 6. COLLECTOR TO EMITTER ON-STATE VOLTAGE
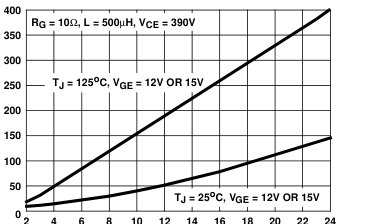
ICE, COLLECTOR TO EMITTER CURRENT (A)
FIGURE 8. TURN-OFF ENERGY LOSS vs COLLECTOR TO
EMITTER CURRENT
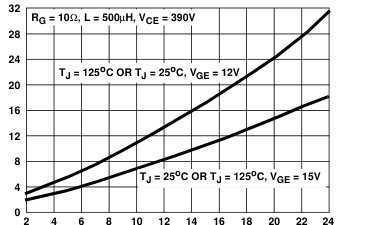
ICE, COLLECTOR TO EMITTER CURRENT (A)
FIGURE 10. TURN-ON RISE TIME vs COLLECTOR TO
EMITTER CURRENT
Page 5
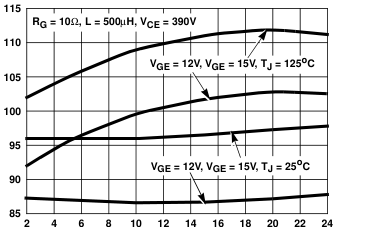
ICE, COLLECTOR TO EMITTER CURRENT (A)
FIGURE 11. TURN-OFF DELAY TIME vs COLLECTOR TO
EMITTER CURRENT
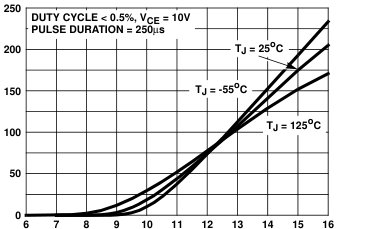
VGE, GATE TO EMITTER VOLTAGE (V)
FIGURE 13. TRANSFER CHARACTERISTIC
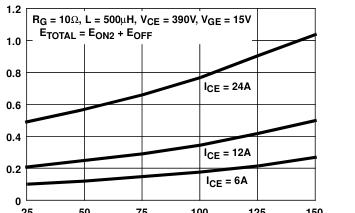
25 50 75 100 125 150
TC, CASE TEMPERATURE (oC)
FIGURE 15. TOTAL SWITCHING LOSS vs CASE
TEMPERATURE
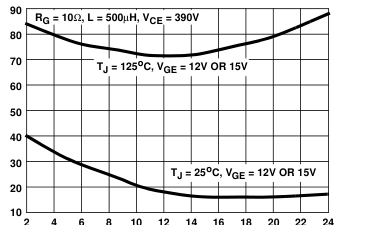
ICE, COLLECTOR TO EMITTER CURRENT (A)
FIGURE 12. FALL TIME vs COLLECTOR TO EMITTER
CURRENT
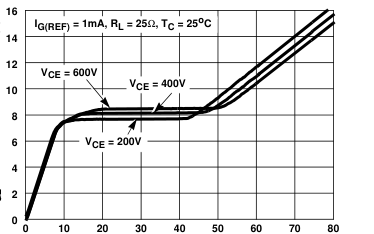
QG, GATE CHARGE (nC)
FIGURE 14. GATE CHARGE WAVEFORMS
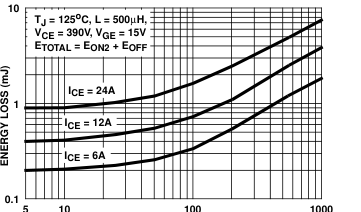
RG, GATE RESISTANCE (Ω)
FIGURE 16. TOTAL SWITCHING LOSS vs GATE RESISTANCE
Page 6
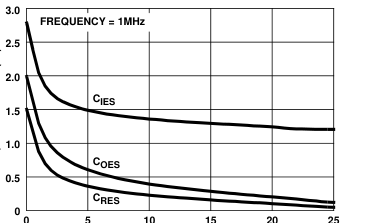
VCE, COLLECTOR TO EMITTER VOLTAGE (V)
FIGURE 17. CAPACITANCE vs COLLECTOR TO EMITTER
VOLTAGE
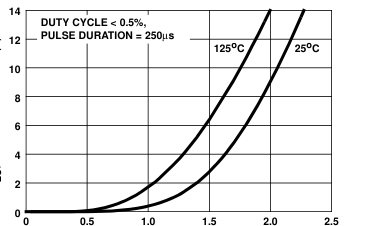
VEC, FORWARD VOLTAGE (V)
FIGURE 19. DIODE FORWARD CURRENT vs FORWARD
VOLTAGE DROP
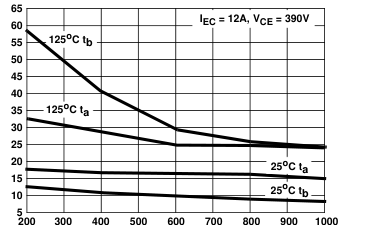
diEC/dt, RATE OF CHANGE OF CURRENT (A/µs)
FIGURE 21. RECOVERY TIMES vs RATE OF CHANGE OF
CURRENT
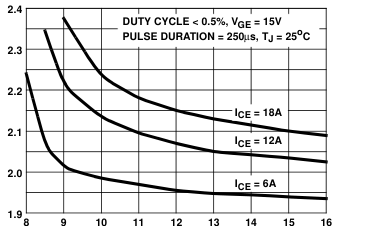
VGE, GATE TO EMITTER VOLTAGE (V)
FIGURE 18. COLLECTOR TO EMITTER ON-STATE VOLTAGE
vs GATE TO EMITTER VOLTAGE
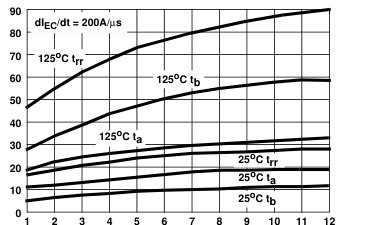
IEC, FORWARD CURRENT (A)
FIGURE 20. RECOVERY TIMES vs FORWARD CURRENT
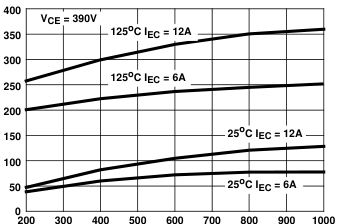
diEC/dt, RATE OF CHANGE OF CURRENT (A/µs)
FIGURE 22. STORED CHARGE vs RATE OF CHANGE OF
CURRENT
Page 7
t1, RECTANGULAR PULSE DURATION (s)
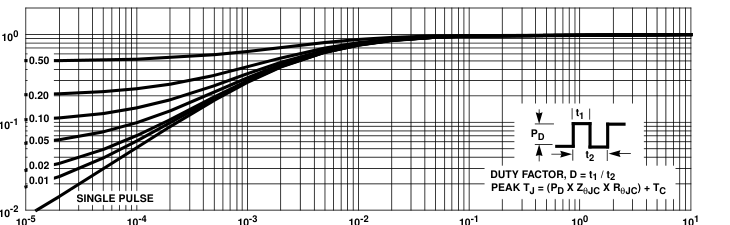
FIGURE 23. IGBT NORMALIZED TRANSIENT THERMAL RESPONSE, JUNCTION TO CASE
Test Circuit and Waveforms
| 90% 10% | ||
| EON EOFF 90% 10% td(OFF)I tfI | 2 trI td(ON)I | |
VGE
VCE
ICE
VDD = 390V
FIGURE 24. INDUCTIVE SWITCHING TEST CIRCUIT
FIGURE 25. SWITCHING TEST WAVEFORMS
Page 8
Handling Precautions for IGBTs
Insulated Gate Bipolar Transistors are susceptible to gate-insulation damage by the electrostatic discharge of energy through the devices. When handling these devices, care should be exercised to assure that the static charge built in the handler’s body capacitance is not discharged through the device. With proper handling and application procedures, however, IGBTs are currently being extensively used in production by numerous equipment manufacturers in military, industrial and consumer applications, with virtually no damage problems due to electrostatic discharge. IGBTs can be handled safely if the following basic precautions are taken:
- Prior to assembly into a circuit, all leads should be kept shorted together either by the use of metal shorting springs or by the insertion into conductive material such as “ECCOSORBD™ LD26” or equivalent. 2. When devices are removed by hand from their carriers, the hand being used should be grounded by any suitable means - for example, with a metallic wristband. 3. Tips of soldering irons should be grounded. 4. Devices should never be inserted into or removed from circuits with power on. 5. Gate Voltage Rating - Never exceed the gate-voltage rating of VGEM. Exceeding the rated VGE can result in permanent damage to the oxide layer in the gate region. 6. Gate Termination - The gates of these devices are
essentially capacitors. Circuits that leave the gate opencircuited or floating should be avoided. These conditions can result in turn-on of the device due to voltage buildup on the input capacitor due to leakage currents or pickup. 7. Gate Protection - These devices do not have an internal monolithic Zener diode from gate to emitter. If gate protection is required an external Zener is recommended.
Operating Frequency Information
Operating frequency information for a typical device (Figure 3) is presented as a guide for estimating device performance for a specific application. Other typical frequency vs collector current (ICE) plots are possible using the information shown for a typical unit in Figures 5, 6, 7, 8, 9 and 11. The operating frequency plot (Figure 3) of a typical device shows fMAX1 or fMAX2; whichever is smaller at each point. The information is based on measurements of a typical device and is bounded by the maximum rated junction temperature.
fMAX1 is defined by fMAX1 = 0.05/(td(OFF)I+ td(ON)I). Deadtime (the denominator) has been arbitrarily held to 10% of the on-state time for a 50% duty factor. Other definitions are possible. td(OFF)I and td(ON)I are defined in Figure 25. Device turn-off delay can establish an additional frequency limiting condition for an application other than TJM. td(OFF)I is important when controlling output ripple under a lightly loaded condition.
fMAX2 is defined by fMAX2 = (PD - PC)/(EOFF + EON2). The allowable dissipation (PD) is defined by PD = (TJM - TC)/RθJC. The sum of device switching and conduction losses must not exceed PD. A 50% duty factor was used (Figure 3) and the conduction losses (PC) are approximated by PC = (VCE x ICE)/2. EON2 and EOFF are defined in the switching waveforms shown in Figure 25. EON2 is the integral of the instantaneous power loss (ICE x VCE) during turn-on and EOFF is the integral of the instantaneous power loss (ICE x VCE) during turn-off. All tail losses are included in the calculation for EOFF; i.e., the collector current equals zero (ICE = 0).