


 Download PDF
HFA240NJ40CPBF VISHAY
Document overview
- PDF pages: 7
Technical content
Page 1
Ultrafast Soft Recovery Diode, 240 A
FEATURES
- Very low Qrr and trr
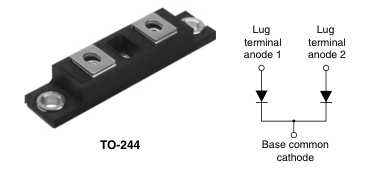
- Lead (Pb)-free
- Designed and qualified for industrial level
RoHS
COMPLIANT
BENEFITS
- Reduced RFI and EMI
- Reduced snubbing
DESCRIPTION
HEXFRED® diodes are optimized to reduce losses and EMI/RFI in high frequency power conditioning systems. An extensive characterization of the recovery behavior for different values of current, temperature and dI/dt simplifies
| PRODUCT SUMMARY | |
| I F(AV) | 240 A |
| V R | 400 V |
| I at T F(DC) C | 197 A at 100 °C |
the calculations of losses in the operating conditions. The softness of the recovery eliminates the need for a snubber in most applications. These devices are ideally suited for power converters, motors drives and other applications where switching losses are significant portion of the total losses.
| ABSOLUTE MAXIMUM RATINGS | ||||
|---|---|---|---|---|
| PARAMETER | SYMBOL | TEST CONDITIONS | MAX. | UNITS |
| Cathode to anode voltage | V R | 400 | V | |
| Continuous forward current | I F | T = 25 °C C | 395 | A |
| T = 100 °C C | 197 | |||
| Single pulse forward current | I FSM | Limited by junction temperature | 900 | |
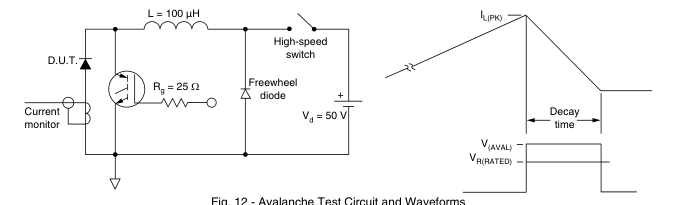
| Non-repetitive avalanche energy | E AS | L = 100 µH, duty cycle limited by maximum T J | 1.4 | mJ |
| Maximum power dissipation | P D | T = 25 °C C | 658 | W |
| T = 100 °C C | 263 | |||
| Operating junction and storage temperature range | T , T J Stg | - 55 to + 150 | °C | |
| ELECTRICAL SPECIFICATIONS (T = 25 °C unless otherwise specified) J | |||||||
| PARAMETER | SYMBOL | TEST CONDITIONS | MIN. | TYP. | MAX. | UNITS | |
| Cathode to anode breakdown voltage | V BR | I = 100 µA R | 400 | - | - | V | |
| Maximum forward voltage | V FM | I = 120 A F | See fig. 1 | - | 1.1 | 1.47 | |
| I = 240 A F | - | 1.3 | 1.5 | ||||
| I = 120 A, T = 125 °C F J | - | 1.0 | 1.2 | ||||
| Maximum reverse leakage current | I RM | T = 125 °C, V = 400 V J R | See fig. 2 | - | 660 | 5000 | µA |
| Junction capacitance | C T | V = 200 V R | See fig. 3 | - | 280 | 380 | pF |
| Series inductance | L S | From top of terminal hole to mounting plane | - | 6.0 | - | nH | |
Page 2
Diode, 240 A
| DYNAMIC RECOVERY CHARACTERISTICS (T = 25 °C unless otherwise specified) J | |||||||
| PARAMETER | SYMBOL | TEST CONDITIONS | MIN. | TYP. | MAX. | UNITS | |
| Reverse recovery time See fig. 5 | t rr | I = 1.0 A, dI /dt = 200 A/µs, V = 30 V F F R | - | 50 | - | ns | |
| T = 25 °C J | I = 140 A F dI /dt = 200 A/µs F V = 200 V R | - | 77 | 120 | |||
| T = 125 °C J | - | 290 | 440 | ||||
| Peak recovery current See fig. 6 | I RRM | T = 25 °C J | - | 7.5 | 14 | A | |
| T = 125 °C J | - | 16 | 30 | ||||
| Reverse recovery charge See fig. 7 | Q rr | T = 25 °C J | - | 290 | 780 | nC | |
| T = 125 °C J | - | 2300 | 6300 | ||||
| Peak rate of recovery current See fig. 8 | dI /dt (rec)M | T = 25 °C J | - | 320 | - | A/µs | |
| T = 125 °C J | - | 270 | - | ||||
| THERMAL - MECHANICAL SPECIFICATIONS | |||||
| PARAMETER | SYMBOL | MIN. | TYP. | MAX. | UNITS |
| Maximum junction and storage temperature range | T , T J Stg | - 55 | - | 150 | °C |
| per leg Thermal resistance, junction to case per module | R thJC | - | - | 0.19 | °C/W |
| - | - | 0.095 | |||
| Typical thermal resistance, case to heatsink | R thCS | - | 0.10 | - | |
| Weight | - | 68 | - | g | |
| - | 2.4 | - | oz. | ||
| (1) Mounting torque center hole | 30 (3.4) | - | 40 (4.6) | N ⋅ m (lbf ⋅ in) | |
| 12 (1.4) | - | 18 (2.1) | |||
| Terminal torque | 30 (3.4) | - | 40 (4.6) | ||
| Vertical pull | - | - | 80 | lbf ⋅ in | |
| 2" lever pull | - | - | 35 | ||
Note (1) Mounting surface must be smooth, flat, free of burrs or other protrusions. Apply a thin even film or thermal grease to mounting surface. Gradually tighten each mounting bolt in 5 to 10 lbf ⋅ in steps until desired or maximum torque limits are reached.
Page 3
Diode, 240 A
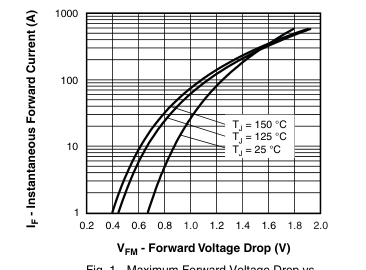
Fig. 1 - Maximum Forward Voltage Drop vs. Instantaneous Forward Current (Per Leg)
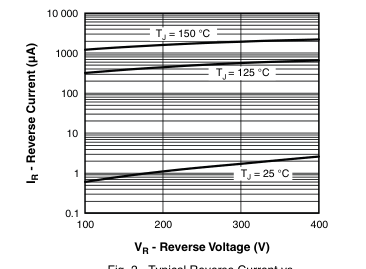
Fig. 2 - Typical Reverse Current vs. Reverse Voltage (Per Leg)
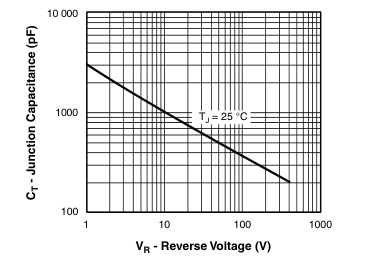
Fig. 3 - Typical Junction Capacitance vs. Reverse Voltage
(Per Leg)
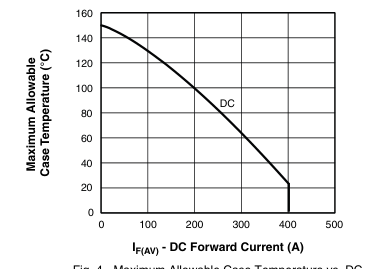
Fig. 4 - Maximum Allowable Case Temperature vs. DC Forward Current (Per Leg)
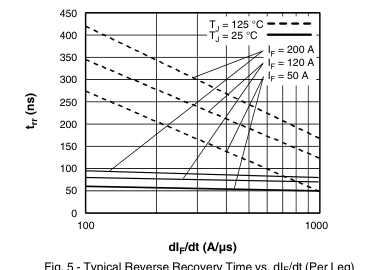
Fig. 5 - Typical Reverse Recovery Time vs. dIF/dt (Per Leg)
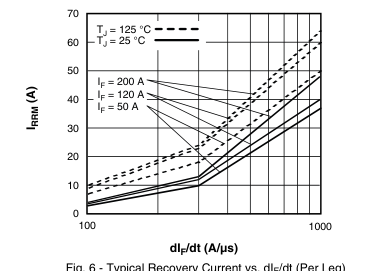
Fig. 6 - Typical Recovery Current vs. dIF/dt (Per Leg)
Page 4
Diode, 240 A
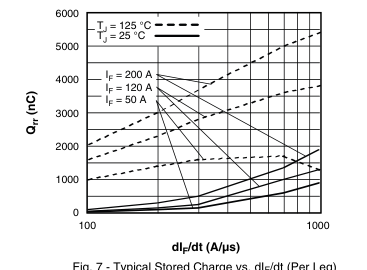
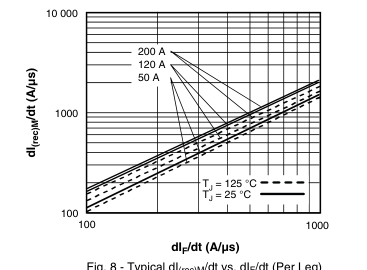
Fig. 7 - Typical Stored Charge vs. dIF/dt (Per Leg)
Fig. 8 - Typical dI(rec)M/dt vs. dIF/dt (Per Leg)
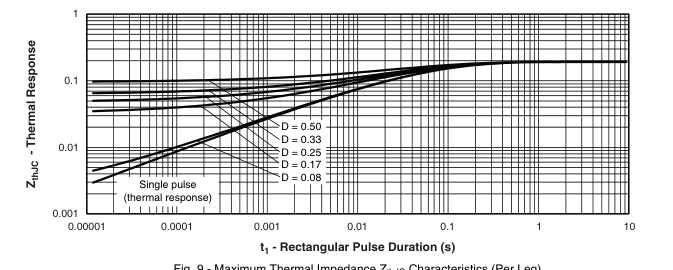
Fig. 9 - Maximum Thermal Impedance ZthJC Characteristics (Per Leg)
Page 5
Diode, 240 A
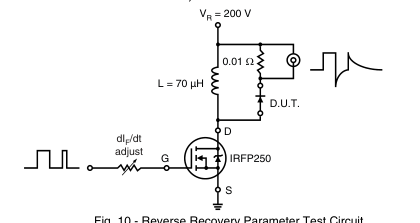
Fig. 10 - Reverse Recovery Parameter Test Circuit
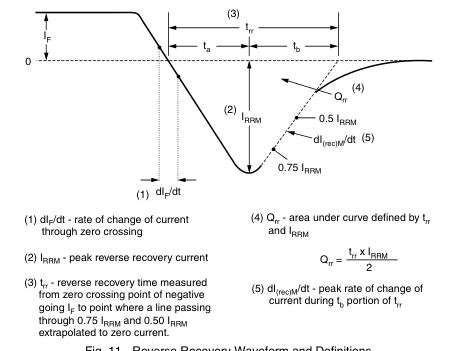
Fig. 11 - Reverse Recovery Waveform and Definitions
Page 6
Diode, 240 A
ORDERING INFORMATION TABLE
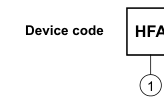
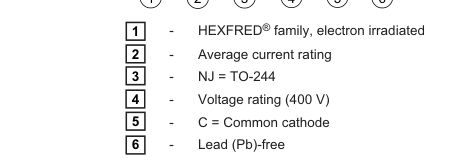
| HFA | 240 | NJ | 40 | C | PbF |
| 1 2 3 4 5 6 | |||||
| LINKS TO RELATED DOCUMENTS | |
| Dimensions | http://www.vishay.com/doc?95021 |
Page 7
Legal Disclaimer Notice
Vishay
Disclaimer
All product specifications and data are subject to change without notice.
Vishay Intertechnology, Inc., its affiliates, agents, and employees, and all persons acting on its or their behalf (collectively, “Vishay”), disclaim any and all liability for any errors, inaccuracies or incompleteness contained herein or in any other disclosure relating to any product.
Vishay disclaims any and all liability arising out of the use or application of any product described herein or of any information provided herein to the maximum extent permitted by law. The product specifications do not expand or otherwise modify Vishay’s terms and conditions of purchase, including but not limited to the warranty expressed therein, which apply to these products.
No license, express or implied, by estoppel or otherwise, to any intellectual property rights is granted by this document or by any conduct of Vishay.
The products shown herein are not designed for use in medical, life-saving, or life-sustaining applications unless otherwise expressly indicated. Customers using or selling Vishay products not expressly indicated for use in such applications do so entirely at their own risk and agree to fully indemnify Vishay for any damages arising or resulting from such use or sale. Please contact authorized Vishay personnel to obtain written terms and conditions regarding products designed for such applications.
Product names and markings noted herein may be trademarks of their respective owners.
Document Number: 91000 Revision: 18-Jul-08