


 Download PDF
DATASHEET SEARCH SITE
Document overview
- PDF pages: 6
Technical content
Page 1
Bulletin PD -20058 01/01
HFA08TA60CS
HEXFRED
Ultrafast, Soft Recovery Diode
TM
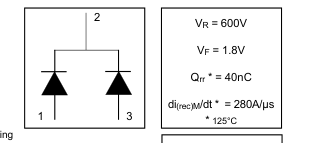
Features
- Ultrafast Recovery
- Ultrasoft Recovery
- Very Low IRRM
- Very Low Qrr
- Specified at Operating Conditions
Benefits
- Reduced RFI and EMI
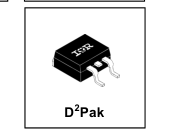
- Reduced Power Loss in Diode and Switching Transistor
- Higher Frequency Operation
- Reduced Snubbing
- Reduced Parts Count
Description
International Rectifier's HFA08TA60CS is a state of the art center tap ultra fast recovery diode. Employing the latest in epitaxial construction and advanced processing techniques it features a superb combination of characteristics which result in performance which is unsurpassed by any rectifier previously available. With basic ratings of 600 volts and 4 amps per Leg continuous current, the HFA08TA60CS is especially well suited for use as the companion diode for IGBTs and MOSFETs. In addition to ultra fast recovery time, the HEXFRED product line features extremely low values of peak recovery current (IRRM) and does not exhibit any tendency to "snap-off" during the tb portion of
recovery. The HEXFRED features combine to offer designers a rectifier with lower noise and significantly lower switching losses in both the diode and the switching transistor. These HEXFRED advantages can help to significantly reduce snubbing, component count and heatsink sizes. The HEXFRED HFA08TA60CS is ideally suited for applications in power supplies and power conversion systems (such as inverters), motor drives, and many other similar applications where high speed, high efficiency is needed.
Absolute Maximum Ratings
| Parameter | Max | Units | |
|---|---|---|---|
| VR | Cathode-to-Anode Voltage | 600 | V |
| IF @ TC = 100°C | Continuous Forward Current | 4 0 | A |
| IFSM | Single Pulse Forward Current | 25 | |
| IFRM | Maximum Repetitive Forward Current | 16 | |
| PD @ TC = 25°C | Maximum Power Dissipation | 25 | W |
| PD @ TC = 100°C | Maximum Power Dissipation | 10 | |
| TJ | Operating Junction and | -55 to +150 | C |
| TSTG | Storage Temperature Range |
1
Page 2
HFA08TA60CS
Bulletin PD-20058 01/01
Electrical Characteristics @ TJ = 25°C (unless otherwise specified)
| Parameter | Min | Typ | Max | Units | Test Conditions | |
|---|---|---|---|---|---|---|
| VBR | Cathode Anode Breakdown Voltage | 600 | V | R = 100µA | ||
| VFM | Max Forward Voltage | 1.5 | 1.8 | V | IF = 4.0A IF = 8.0A See Fig. 1 IF = 4.0A, TJ = 125°C | |
| 1.8 | 2.2 | |||||
| 1.4 | 1.7 | |||||
| IRM | Max Reverse Leakage Current | 0.17 | 3.0 | µA | VR = VR Rated See Fig. 2 TJ = 125°C, VR = 0 8 x VR Rated | |
| 44 | 300 | |||||
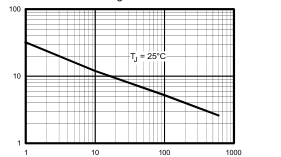
| CT | Junction Capacitance | 4.0 | 8.0 | pF | VR = 200V See Fig. 3 | |
| LS | Series Inductance | 8.0 | nH | Measured lead to lead 5mm from package body |
Dynamic Recovery Characteristics @ TJ = 25°C (unless otherwise specified)
| Parameter | Min | Typ | Max | Units | Test Conditions | ||
|---|---|---|---|---|---|---|---|
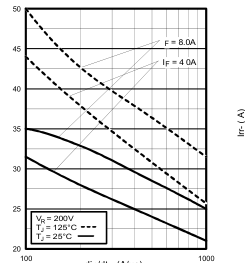
| trr trr1 trr2 | Reverse Recovery Time See Fig. 5, 6 & 16 | 17 | ns | IF = 1.0A, dif/dt = 200A/µs, VR = 30V | |||
| 28 | 42 | TJ = 25°C TJ = 125°C | IF = 4 0A VR = 200V dif/dt = 200A/µs | ||||
| 38 | 57 | ||||||
| IRRM1 IRRM2 | Peak Recovery Current See Fig. 7& 8 | 2.9 | 5.2 | TJ = 25°C TJ = 125°C | |||
| 3.7 | 6.7 | ||||||
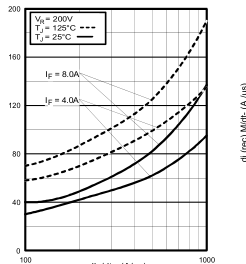
| Qrr1 Qrr2 | Reverse Recovery Charge See Fig. 9 & 10 | 40 | 60 | TJ = 25°C TJ = 125°C | |||
| 70 | 105 | ||||||
| di(rec)M/dt1 di(rec)M/dt2 | Peak Rate of Fall of Recovery Current During tb See Fig. 11 & 12 | 280 | TJ = 25°C TJ = 125°C | ||||
| 235 | |||||||
Thermal - Mechanical Characteristics
| Parameter | Min | Typ | Max | Units | |
|---|---|---|---|---|---|
| Tlead! | Lead Temperature | 300 | °C | ||
| RthJC | Thermal Resistance, Junction to Case | 5 0 | K/W | ||
| RthJA " | Thermal Resistance, Junction to Ambient | 80 | |||
| Wt | Weight | 2.0 | g | ||
| 0 07 | (oz) | ||||
| T | Mounting Torque | 6.0 | 12 | Kg-cm | |
| 5.0 | 10 | lbf•in |
! 0.063 in. from Case (1.6mm) for 10 sec " Typical Socket Mount
2
www.irf.com
Page 3
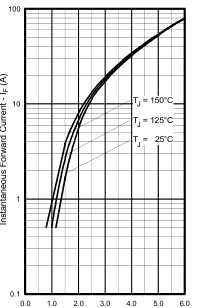
Forward Voltage Drop - VFM ( V )
Fig. 1 - Maximum Forward Voltage Drop
vs. Instantaneous Forward Current,
HFA08TA60CS
Bulletin PD-20058 01/01
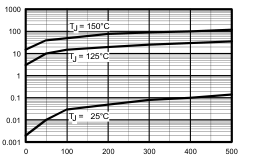
Reverse Voltage - V (V)
R
Fig. 2 - Typical Reverse Current vs. Reverse
Voltage
Reverse Voltage - V (V)
R
Fig. 3 - Typical Junction Capacitance vs.
www.irf.com
3
Page 4
HFA08TA60CS
Bulletin PD-20058 01/01
di /dt - (A/µs) f
Fig. 5 - Typical Reverse Recovery vs. dif/dt
di /dt - (A/µs) f
Fig. 7 - Typical Stored Charge vs. dif/dt
4
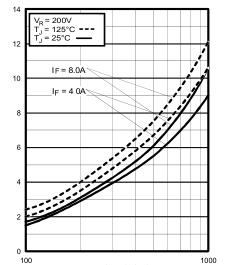
di /dt - (A/µs) f
Fig. 6 - Typical Recovery Current vs. dif/dt
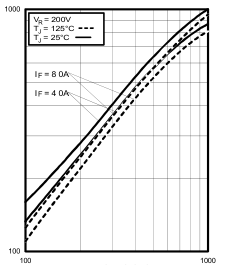
di /dt - (A/µs) f
Fig. 8 - Typical di(rec)M/dt vs. dif/dt,
www.irf.com
Page 5
0
REVERSE RECOVERY C RCUIT
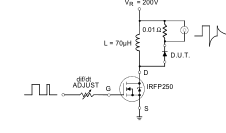
Fig. 9 - Reverse Recovery Parameter Test
Circuit
www.irf.com
HFA08TA60CS
Bulletin PD-20058 01/01
| F | 3 trr ta tb | |
| Qrr 2 I RRM 0.5I RRM di(rec)M/dt 5 0.75 IRRM | ||
di /dt f
- Qrr - Area under curve defined by trr
- dif/dt - Rate of change of current
and IRRM
through zero crossing
trr X IRRM Qrr =
- IRRM - Peak reverse recovery current
2
- trr - Reverse recovery time measured
- di(rec)M/dt - Peak rate of change of
from zero crossing point of negative
current during tb portion of trr
going IF to point where a line passing through 0.75 IRRM and 0.50 IRRM extrapolated to zero current
Fig. 10 - Reverse Recovery Waveform and
Definitions
5
Page 6
HFA08TA60CS
Bulletin PD-20058 01/01
IR WORLD HEADQUARTERS 233 Kansas St., El Segundo, California 90245, USA Tel: (310) 252-7105
TAC Fax: (310) 252-7309
Visit us at www.irf.com for sales contact information. 01/01
6