

 Download PDF
DDC112 BURR-BROWN
Document overview
- PDF pages: 24
Technical content
Page 1
For most current data sheet and other product information, visit www.burr-brown.com
Dual Current Input 20-Bit
ANALOG-TO-DIGITAL CONVERTER
FEATURES
G MONOLITHIC CHARGE MEASUREMENT ADC G DIGITAL FILTER NOISE REDUCTION: 3.2ppm, rms G INTEGRAL LINEARITY: ±0.005% Reading ±0.5ppm FSR G HIGH PRECISION, TRUE INTEGRATING
FUNCTION
G PROGRAMMABLE FULL SCALE G SINGLE SUPPLY G CASCADABLE OUTPUT
APPLICATIONS
G DIRECT PHOTOSENSOR DIGITIZATION G CT SCANNER DAS G INFRARED PYROMETER G PRECISION PROCESS CONTROL G LIQUID/GAS CHROMATOGRAPHY G BLOOD ANALYSIS
Protected by US Patent #5841310
AVDD AGND
CAP1A
CHANNEL 1
CAP1A
IN1
Dual Switched
CAP1B
Integrator
CAP1B CAP2A CAP2A
CHANNEL 2
IN2
Dual Switched
CAP2B
Integrator
CAP2B
DESCRIPTION
The DDC112 is a dual input, wide dynamic range, charge-digitizing analog-to-digital converter (ADC) with 20-bit resolution. Low level current output devices, such as photosensors, can be directly connected to its inputs. Charge integration is continuous as each input uses two integrators; while one is being digitized, the other is integrating. For each of its two inputs, the DDC112 combines current-to-voltage conversion, continuous integration, programmable full-scale range, A/D conversion, and digital filtering to achieve a precision, wide dynamic range digital result. In addition to the internal programmable full-scale ranges, external integrating capacitors
allow an additional user-settable full-scale range of up to 1000pC. To provide single-supply operation, the internal ADC utilizes a differential input, with the positive input tied to VREF. When the integration capacitor is reset at the beginning of each integration cycle, the capacitor charges to VREF. This charge is removed in proportion to the input current. At the end of the integration cycle, the remaining voltage is compared to VREF. The high-speed serial shift register which holds the result of the last conversion can be configured to allow multiple DDC112 units to be cascaded, minimizing interconnections. The DDC112 is available in a SO-28 package and is offered in two performance grades.
VREF
DVDD DGND
DCLK
DVALID DXMIT
Digital Digital
∆Σ Modulator
DOUT
Filter Input/Output
DIN
RANGE2 RANGE1
Control
RANGE0
TEST CONV CLK
International Airport Industrial Park • Mailing Address: PO Box 11400, Tucson, AZ 85734 • Street Address: 6730 S. Tucson Blvd., Tucson, AZ 85706 • Tel: (520) 746-1111 Twx: 910-952-1111 • Internet: http://www.burr-brown.com/ • Cable: BBRCORP • Telex: 066-6491 • FAX: (520) 889-1510 • Immediate Product Info: (800) 548-6132
©1997 Burr-Brown Corporation
PDS-1421D
Printed in U.S.A. January, 2000
Page 2
SPECIFICATIONS
At TA = +25°C, AVDD = DVDD = +5V, DDC112U: TINT = 500µs, CLK = 10MHz, DDC112UK: TINT = 333.3µs, CLK = 15MHz, VREF = +4.096V, continuous mode operation, and internal integration capacitors, unless otherwise noted.
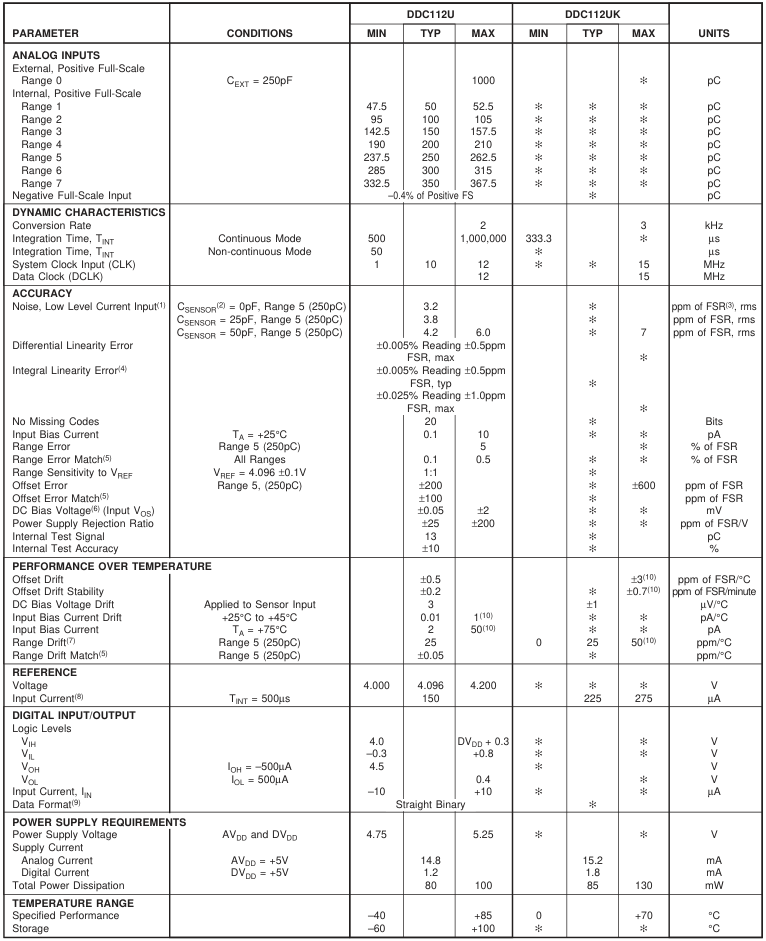
NOTES: (1) Input is less than 1% of full scale. (2) CSENSOR is the capacitance seen at the DDC112 inputs from wiring, photodiode, etc. (3) FSR is Full-Scale Range. (4) A best-fit line is used in measuring linearity. (5) Matching between side A and side B, not input 1 to input 2. (6) Voltage produced by the DDC112 at its input which is applied to the sensor. (7) Range drift does not include external reference drift. (8) Input reference current decreases with increasing TINT (see text). (9) Data format is Straight Binary with a small offset (see text). (10) Guaranteed but not tested.
Page 3
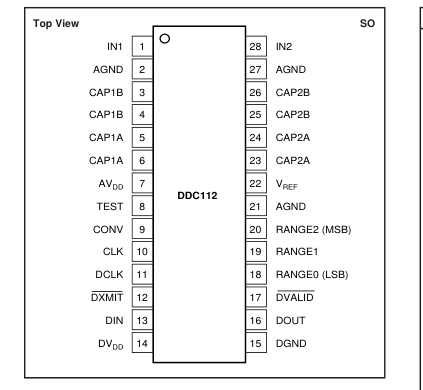
PIN CONFIGURATION
ABSOLUTE MAXIMUM RATINGS(1)
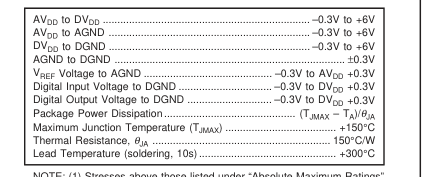
NOTE: (1) Stresses above those listed under “Absolute Maximum Ratings” may cause permanent damage to the device. Exposure to absolute maximum conditions for extended periods may affect device reliability.
ELECTROSTATIC
DISCHARGE SENSITIVITY
This integrated circuit can be damaged by ESD. Burr-Brown
recommends that all integrated circuits be handled with
appropriate precautions. Failure to observe proper handling and
installation procedures can cause damage.
ESD damage can range from subtle performance degradation to
complete device failure. Precision integrated circuits may be more
susceptible to damage because very small parametric changes
could cause the device not to meet its published specifications.
PACKAGE/ORDERING INFORMATION
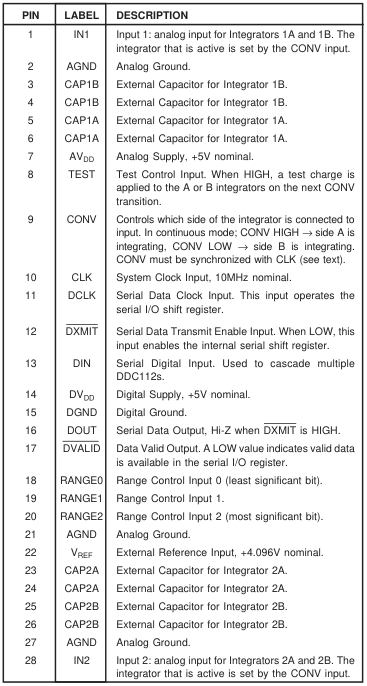
PIN DESCRIPTIONS
The information provided herein is believed to be reliable; however, BURR-BROWN assumes no responsibility for inaccuracies or omissions. BURR-BROWN assumes no responsibility for the use of this information, and all use of such information shall be entirely at the user’s own risk. Prices and specifications are subject to change without notice. No patent rights or licenses to any of the circuits described herein are implied or granted to any third party. BURR-BROWN does not authorize or warrant any BURR- BROWN product for use in life support devices and/or systems.
| PRODUCT | MAXIMUM INTEGRAL LINEARITY ERROR | SPECIFICATION TEMPERATURE RANGE | PACKAGE | PACKAGE DRAWING NUMBER | ORDERING NUMBER(1) | TRANSPORT MEDIA |
|---|---|---|---|---|---|---|
| DDC112U " DDC112UK " | ±0.025% Reading ±1.0ppm% FSR " ±0.025% Reading ±1.0ppm% FSR " | –40°C to +85°C " 0°C to +70°C " | SO-28 " SO-28 " | 217 " 217 " | DDC112U DDC112U/1K DDC112UK DDC112UK/1K | Rails Tape and Reel Rails Tape and Reel |
NOTES: (1) Models with a slash (/) are available only in Tape and Reel in the quantities indicated (e.g., /1K indicates 1000 devices per reel). Ordering 1000 pieces of “DDC112U/1K” will get a single 1000-piece Tape and Reel.
Page 4
TYPICAL PERFORMANCE CURVES
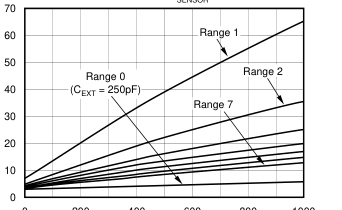
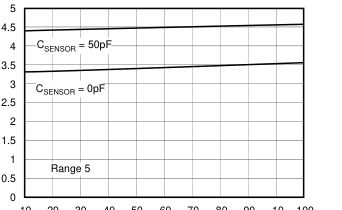
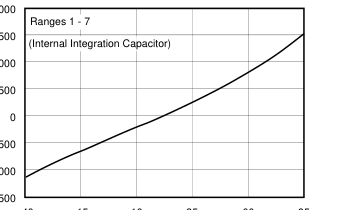
At TA = +25°C, characterization done with Range 5 (250pC), TINT = 500µs, VREF = +4.096, AVDD = DVDD = +5V, and CLK = 10MHz, unless otherwise noted.
NOISE vs CSENSOR
0 200 400 600 800 1000
CSENSOR (pF)
NOISE vs INPUT LEVEL
10 20 30 40 50 60 70 80 90 10 100
Input Level (% of Full-Scale)
RANGE DRIFT vs TEMPERATURE
2000
1500
1000
–500
–1000
–1500 –40 –15 10 35 60 85
Temperature (°C)
NOISE vs TINT
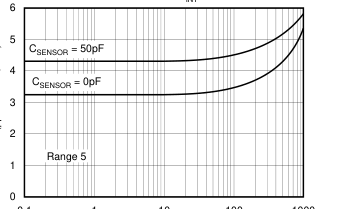
0.1 1 10 100 1000
TINT (ms)
NOISE vs TEMPERATURE
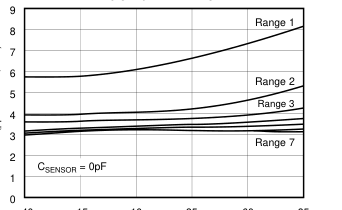
–40 –15 10 35 60 85
Temperature (°C)
IB vs TEMPERATURE
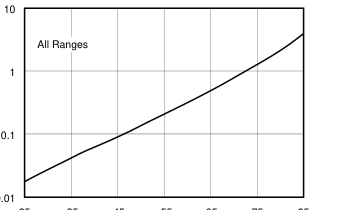
25 35 45 55 65 75 85
Temperature (°C)
Page 5
TYPICAL PERFORMANCE CURVES (Cont.)
At TA = +25°C, characterization done with Range 5 (250pC), TINT = 500µs, VREF = +4.096, AVDD = DVDD = +5V, and CLK = 10MHz, unless otherwise noted.
OFFSET DRIFT vs TEMPERATURE
INPUT VOS vs RANGE
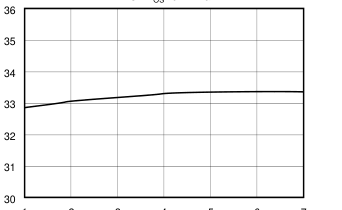
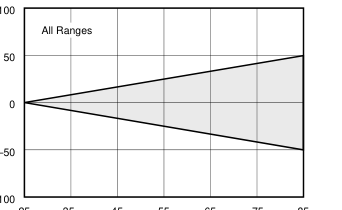
–100 25 35 45 55 65 75 85
1 2 3 4 5 6 7
Range
Temperature (°C)
DIGITAL SUPPLY CURRENT vs TEMPERATURE
ANALOG SUPPLY CURRENT vs TEMPERATURE
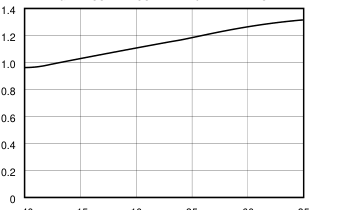
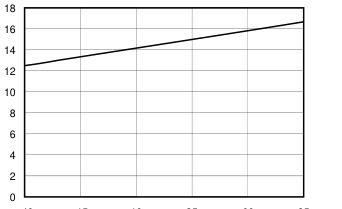
–40 –15 10 35 60 85
–40 –15 10 35 60 85
Temperature (°C)
Temperature (°C)
POWER SUPPLY REJECTION RATIO vs FREQUENCY
CROSSTALK vs FREQUENCY
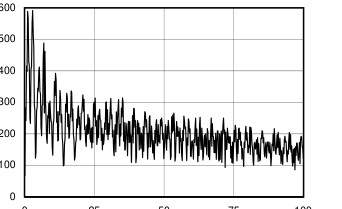
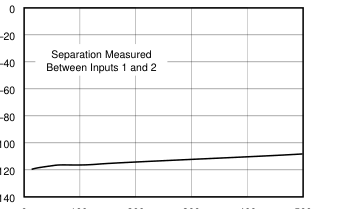
–100
–120
–140
0 25 50 75 100
0 100 200 300 400 500
Frequency (KHz)
Frequency (Hz)
Page 6
THEORY OF OPERATION
The basic operation of the DDC112 is illustrated in Figure 1. The device contains two identical input channels where each performs the function of current-to-voltage integration followed by a multiplexed analog-to-digital (A/D) conversion. Each input has two integrators so that the current-to-voltage integration can be continuous in time. The output of the four integrators are switched to one delta-sigma converter via a four input multiplexer. With the DDC112 in the continuous integration mode, the output of the integrators from one side of both of the inputs will be digitized while the other two integrators are in the integration mode as illustrated in the
timing diagram in Figure 2. This integration and A/D conversion process is controlled by the system clock, CLK. With a 10MHz system clock, the integrator combined with the delta-sigma converter accomplishes a single 20-bit conversion in approximately 220µs. The results from side A and side B of each signal input are stored in a serial output shift
register contains valid data.
pin (DVALID), a serial data output pin (DOUT), and a serial data input pin (DIN). The DDC112 contains only one A/D converter, so the conversion process is interleaved between the two inputs, as shown in Figure 2. The integration and conversion process is fundamentally independent of the data retrieval process. Consequently, the CLK frequency and DCLK frequencies need not be the same. DIN is only used when multiple converters are cascaded and should be tied to DGND otherwise. Depending on TINT, CLK, and DCLK, it is possible to daisy chain over 100 converters. This greatly simplifies the interconnection and routing of the digital outputs in those cases where a large number of converters
are needed.
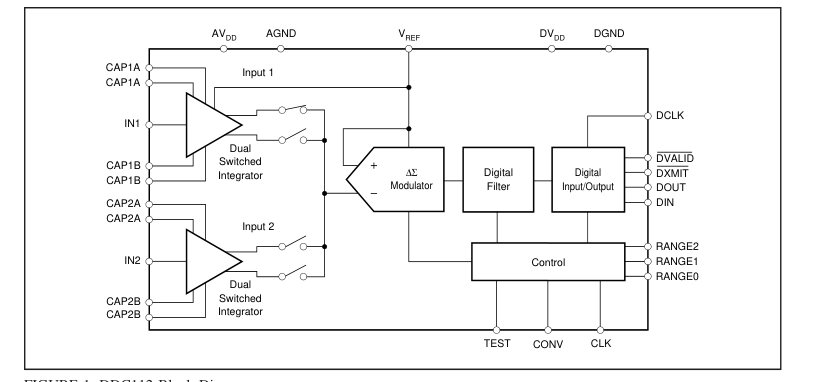
FIGURE 1. DDC112 Block Diagram.
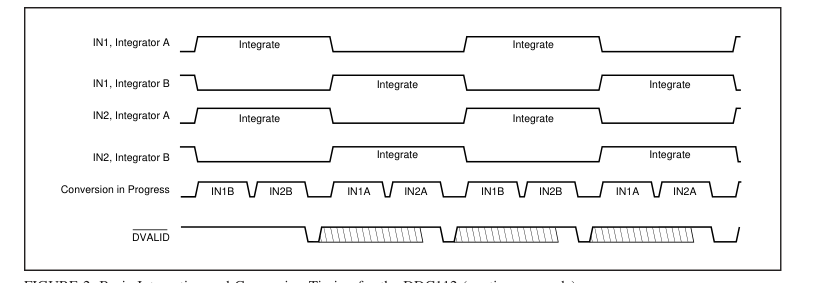
FIGURE 2. Basic Integration and Conversion Timing for the DDC112 (continuous mode).
Page 7
DEVICE OPERATION
Basic Integration Cycle The fundamental topology of the front end of the DDC112 is a classical analog integrator as shown in Figure 3. In this diagram, only Input 1 is shown. This representation of the input stage consists of an operational amplifier, a selectable feedback capacitor network (CF), and several switches that implement the integration cycle. The timing relationships of all of the switches shown in Figure 3 are illustrated in Figure 4. Figure 4 is used to conceptualize the operation of the integrator input stage of the DDC112 and should not be used as an exact timing tool for design. Block diagrams of the reset, integrate, converter and wait states of the integrator
section of the DDC112 are shown in Figure 5. This internal switching network is controlled externally with the convert command (CONV), range selection pins (RANGE0- RANGE2), and the system clock (CLK). For the best noise performance, CONV must be synchronized with the rising edge of CLK. It is recommended CONV toggle within ±10ns of the rising edge of CLK. The non-inverting inputs of the integrators are internally referenced to ground. Consequently, the DDC112 analog ground should be as clean as possible. The range switches, along with the internal and external capacitors (CF) are shown in parallel between the inverting input and output of the operational amplifier. Table I shows the value of the
integration capacitor (CF) for each range. At the beginning of a conversion, the switches SA/D, SINTA, SINTB, SREF1, SREF2, and SRESET are set (see Figure 4). At the completion of an A/D conversion, the charge on the integration capacitor (CF) is reset with SREF1 and
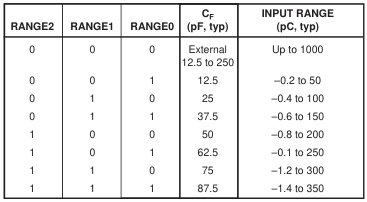
TABLE I. Range Selection of the DDC112.
SRESET (see Figures 4 and 5a). This is done during the reset time. In this manner, the selected capacitor is charged to the reference voltage, VREF. Once the integration capacitor is charged, SREF1, and SRESET are switched so that VREF is no longer connected to the amplifier circuit while it waits to begin integrating (see Figure 5b). With the rising edge on CONV, SINTA closes which begins the integration of Channel A. This puts the integrator stage into its integrate mode (see Figure 5c). Charge from the input signal is collected on the integration capacitor causing the voltage output of the amplifier to decrease. A falling edge CONV stops the integration by
switching the input signal from side A to side B (SINTA and SINTB). Prior to the falling edge of CONV, the signal on side B was converted by the A/D converter and reset during the time that side A was integrating. With the falling edge of CONV, side B starts integrating the input signal. Now the output voltage of side A’s operational amplifier is presented to the input of the ∆Σ A/D converter (see Figure 5d).
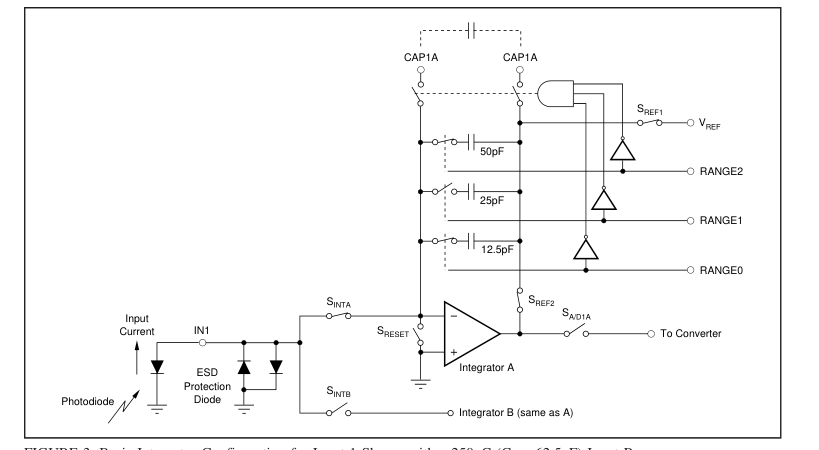
FIGURE 3. Basic Integrator Configuration for Input 1 Shown with a 250pC (CF = 62.5pF) Input Range.
Page 8
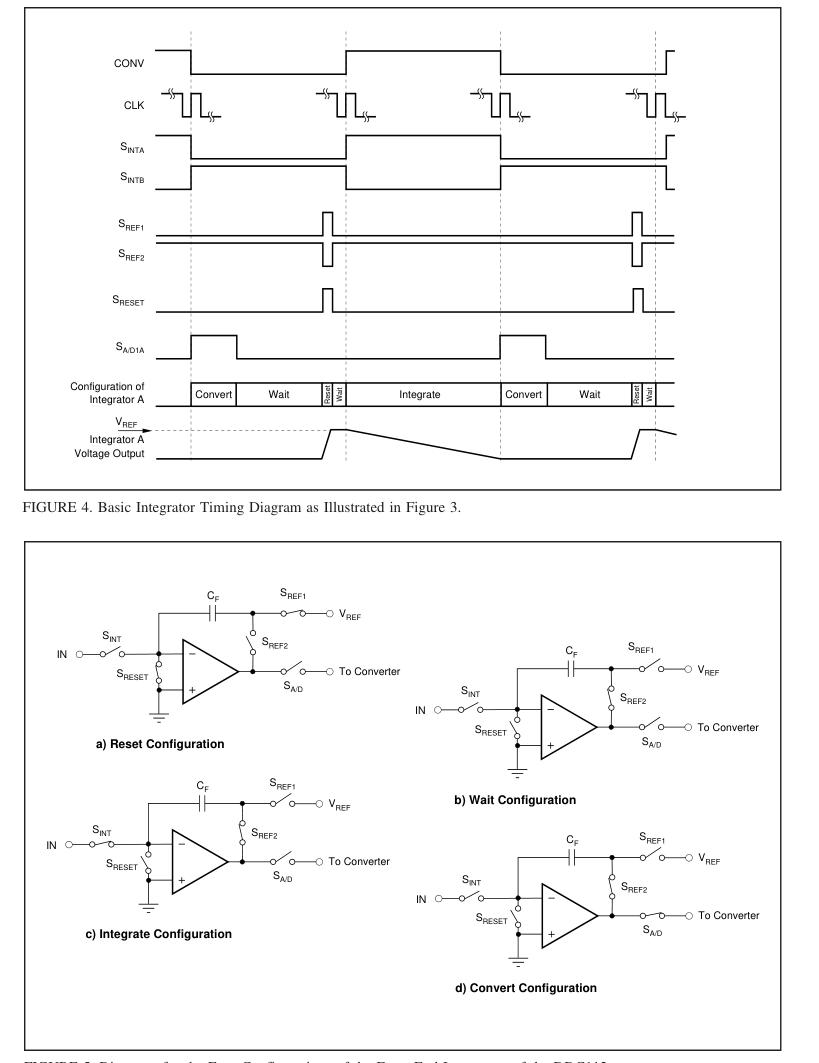
FIGURE 5. Diagrams for the Four Configurations of the Front End Integrators of the DDC112.
Page 9
Determining the Integration Capacitor (CF) Value The value of the integrator’s feedback capacitor, the integration period, and the reference voltage determine the positive full-scale (+FS) value of the DDC112. The approximate positive full-scale value of the DDC112 is given by the following equations:
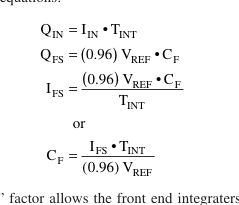
The “0.96” factor allows the front end integraters to reach full scale without having to completely swing to ground. The negative full-scale (–FS) range is approximately 0.4% of the positive full-scale range. For example, Range 5 has a nominal +FS range of 250pC. The –FS range is then ap- proximately –1pC. This relationship holds for external ca- pacitors as well and is independent of VREF (for VREF within the allowable range, see the Specification table). Integration Capacitors There are seven different capacitors available on chip for each side of each channel in the DDC112. These internal capacitors are trimmed in production to achieve the specified performance for range error of the DDC112. The range
control pins (RANGE0-RANGE2) change the capacitor value for all four integrators. Consequently, both inputs and both sides of each input will always have the same full scale range unless external capacitors are used. External integration capacitors may be used instead of the internal capacitors values by setting RANGE2-RANGE0 = 000. The external capacitor pin connections are summarized in Table II. Usually, all four external capacitors are equal in value, however, it is possible to have differing pairs of external capacitors between Input 1 and Input 2 of the DDC112. Regardless of the selected value of the capacitor, it is strongly recommended that the
capacitors for sides A and B be the same.
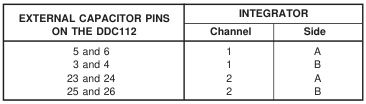
TABLE II. External Capacitor Connections with Range Configuration of RANGE2-RANGE0 = 000.
Since the range accuracy depends on the characteristics of the integration capacitor, they must be carefully selected. An external integration capacitor should have low voltage coefficient, temperature coefficient, memory, and leakage current. The optimum selection depends on the requirements of the specific application. Suitable types include COG ce- ramic, polycarbonate, polystyrene, and silver mica. Voltage Reference The external voltage reference is used to reset the integration capacitors before an integration cycle begins. It is also used by the ∆Σ converter while the converter is measuring the voltage stored on the integrators after an integration cycle
ends. During this sampling, the external reference must supply charge needed by the ∆Σ converter. For an integration time of 500µs, this charge translates to an average VREF current of approximately 150µA. The amount of charge needed by the ∆Σ converter is independent of the integration time, therefore, increasing the integration time lowers the average current. For example, an integration time of 1000µs lowers to average VREF current to 75µA. It is critical that VREF be stable during the different modes of operation shown in Figure 5. The ∆Σ converter measures the voltage on the integrator with respect to VREF. Since the integrator’s capacitors are initially reset to VREF, any droop
in VREF from the time the capacitors are reset to the time when the converter measures the integrator’s output will introduce an offset. It is also important that VREF be stable over longer periods of time as changes in VREF correspond directly to changes in the full-scale range. Finally, VREF should introduce as little additional noise as possible. For reasons mentioned above, it is strongly recommended that the external reference source be buffered with an operational amplifier, as shown in Figure 6. In this circuit, the voltage reference is generated by a 4.096V reference.
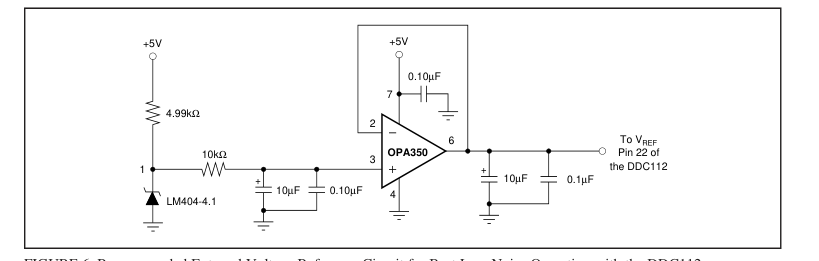
FIGURE 6. Recommended External Voltage Reference Circuit for Best Low Noise Operation with the DDC112.
Page 10
A low-pass filter to reduce noise connects it to an operational amplifier configured as a buffer. This amplifier should have a unity gain bandwidth greater than 4MHz, low noise, and input/output common-mode ranges that support VREF. Following the buffer are capacitors placed close to the DDC112’s VREF pin. Even though the circuit in Figure 6 might appear to be unstable due to the large output capacitors, it works well for most operational amplifiers. It is NOT recommended that series resistance be placed in the output lead to improve stability since this can cause droop in VREF which produces large offsets.
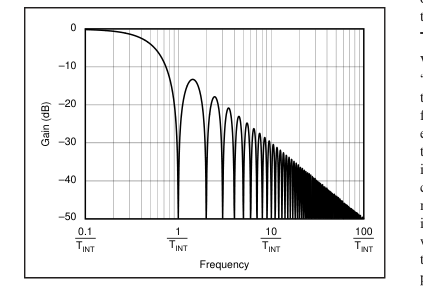
FIGURE 7. Frequency Response of the DDC112.
DDC112 Frequency Response The frequency response of the DDC112 is set by the front end integrators and is that of a traditional continuous time integrator, as shown in Figure 7. By adjusting TINT, the user can change the 3dB bandwidth and the location of the notches in the response. The frequency response of the ∆Σ converter that follows the front end integrator is of no consequence because the converter samples a held signal from the integrators. That is, the input to the ∆Σ converter is always a DC signal. Since the output of the front end integrators are sampled, aliasing can occur. Whenever the frequency of the input signal exceeds one-half of the sampling rate, the signal will “fold” back down
to lower frequencies. Test Mode When TEST is used, pins IN1 and IN2 are grounded and “packets” of approximately 13pC charge are transferred to the integration capacitors of both Input 1 and Input 2. This fixed charge can be transferred to the integration capacitors either once during an integration cycle or multiple times. In the case where multiple packets are transferred during one integration period, the 13pC charge is additive. This mode can be used in both the continuous and non-continuous mode timing. The timing diagrams for test mode are shown in Figure 8. The top three lines in Figure 8 define the timing when one packet of 13pC is sent to the integration capaci-
tors. The bottom three lines define the timing when multiple packets are sent to the integration capacitors.
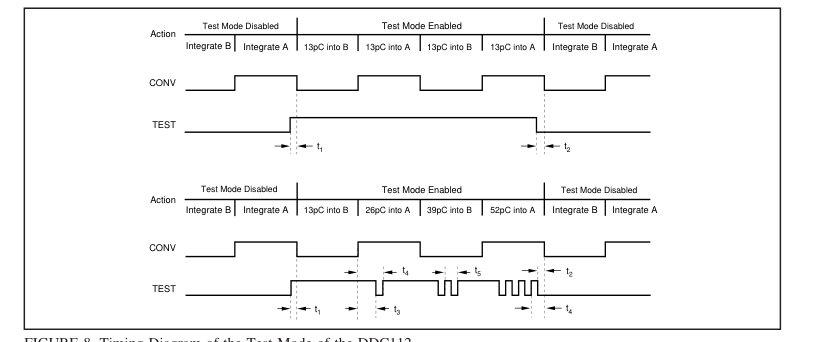
FIGURE 8. Timing Diagram of the Test Mode of the DDC112.
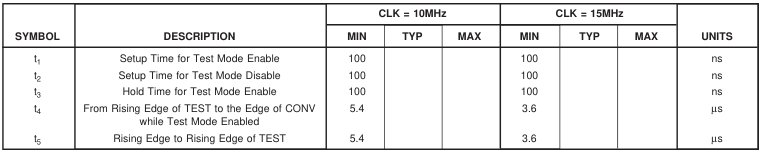
TABLE III. Timing for the DDC112 in the Test Mode.
Page 11
TEST and CONV work together to implement this feature. The test mode is entered when TEST is HIGH prior to a CONV edge. At that point, a CONV edge triggers the grounding of the analog inputs and the switching of 13pC packets of charge onto the integration capacitors. If TEST is kept HIGH through at least two conversions (i.e., a rise and fall of CONV), all four integrators will be charged with a 13pC packet. At the end of each conversion, the voltage at the output of the integrators is digitized as discussed in the “Continuous Mode” and “Non-Continuous Mode” section of this data sheet. The test mode is exited when TEST is LOW and a CONV edge occurs. Once the test mode is entered as described above, TEST can
cycle as many times as desired. When this is done, additional 13pC packets are added on the rising edge of TEST to the existing charge on the integrator capacitors. Multiple charge packets can be added in this way as long as the TEST pin is not LOW when CONV toggles.
DIGITAL ISSUES
The digital interface of the DDC112 provides the digital results via a synchronous serial interface consisting of a data clock (DCLK), a transmit enable pin (DXMIT), a valid data pin (DVALID), a serial data output pin (DOUT), and a serial data input pin (DIN). The DDC112 contains only one A/D converter, so the conversion process is interleaved between the two inputs (see Figure 2). The integration and conversion process is fundamentally independent of the data retrieval process. Consequently, the CLK frequency and DCLK frequencies need not be the same. DIN is used when multiple converters are cascaded. Cascading or “daisy chaining” greatly simplifies the interconnection and routing of the
digital outputs in cases where a large number of converters are needed. Refer to “Cascading Multiple Converters” section of this data sheet for more detail. The conversion rate of the DDC112 is set by a combination of the integration time (determined by the user) and the speed of the A/D conversion process. The A/D conversion time is primarily a function of the system clock (CLK) speed. One A/D conversion cycle encompasses the conversion of two signals (one from each input of the DDC112) and reset time for each of the integrators involved in the two conversions. In most situations, the A/D conversion time is shorter than the integration time. If this condition exists, the DDC112 will
operate in the continuous mode. When the DDC112 is in the continuous mode, the sensor output is continuously integrated by one of the two sides of each input. In the event that the A/D conversion takes longer than the integration time, the DDC112 will switch into a non-continuous mode. In non-continuous mode, the A/D converter is not able to keep pace with the speed of the integration process. Consequently, the integration process is periodically halted until the digitizing process catches up. These two basic modes of operation for the DDC112—continuous and non-continuous modes—are described below.
Continuous and Non-Continuous Operational Modes The state diagram of the DDC112 is shown in Figure 9. In all, there are 8 states. Table IV provides a brief explanation of each of the states.
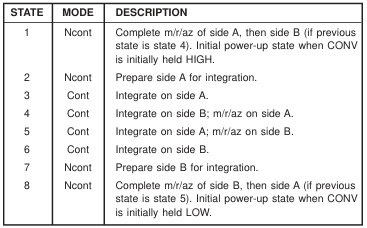
TABLE IV. State Descriptions.
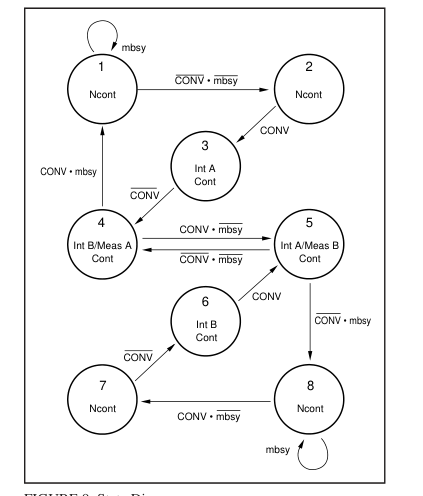
FIGURE 9. State Diagram.
Four signals are used to control progression around the state diagram: CONV and mbsy and their complements. The state machine uses the level as opposed to the edges of CONV to control the progression. mbsy is an internally generated signal not available to the user. It is active whenever a measurement/reset/auto-zero (m/r/az) cycle is in progress.
Page 12
During the cont mode, mbsy is not active when CONV toggles. The non-integrating side is always ready to begin integrating when the other side finishes its integration. Consequently, keeping track of the current status of CONV is all that is needed to know the current state. Cont mode
for Table V can be easily found for a given CLK. For example, if CLK = 10MHz, then a CLK period = 0.1µs. t6 in Table V would then be 479.4µs.
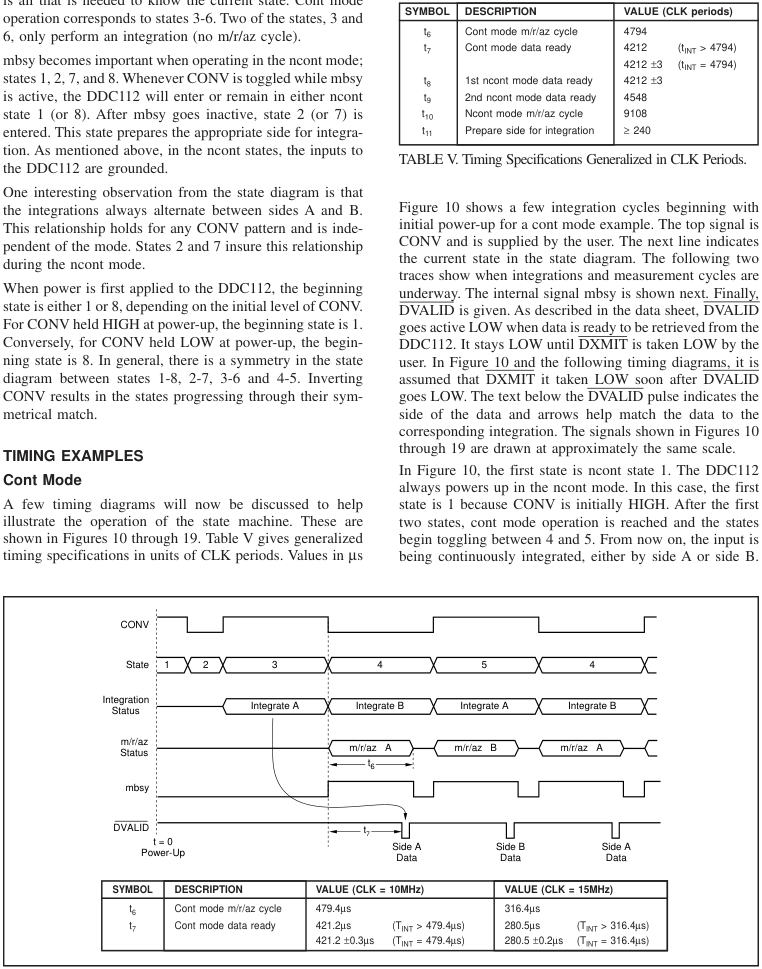
| SYMBOL | DESCRIPTION | VALUE (CLK = 10MHz) | VALUE (CLK = 15MHz) |
|---|---|---|---|
| t 6 t 7 | Cont mode m/r/az cycle Cont mode data ready | 479.4µs 421.2µs (T > 479.4µs) INT 421.2 ±0.3µs (T = 479.4µs) INT | 316.4µs 280.5µs (T > 316.4µs) INT 280.5 ±0.2µs (T = 316.4µs) INT |
FIGURE 10. Continuous Mode Timing (CONV HIGH at power-up).
Page 13
The time needed for the m/r/az cycle, t6, is the same time that
determines the boundary between the cont and ncont modes
described earlier in the Overview section. DVALID goes
LOW after CONV toggles in time t1, indicating that data is
ready to be retrieved. As shown in Figure 10, there are two
values for t7, depending on TINT. The reason for this will be
discussed in the Special Considerations section.
Figure 11 shows the result of inverting the logic level of
CONV. The only difference is in the first three states.
Afterwards, the states toggle between 4 and 5 just as in the
previous example. Figure 12 shows the timing diagram of
the internal operations occurring during continuous mode
operation.
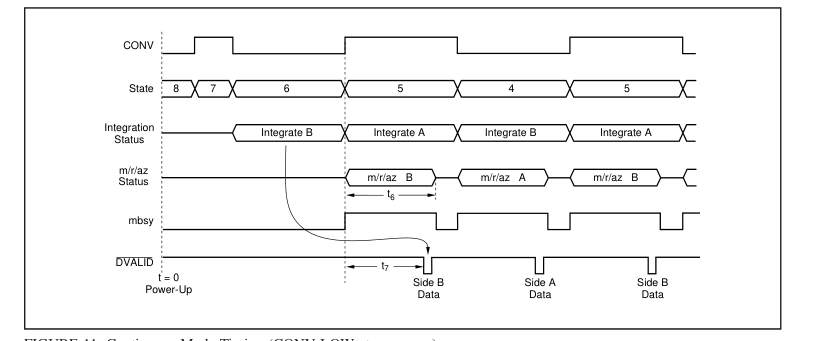
FIGURE 11. Continuous Mode Timing (CONV LOW at power-up).
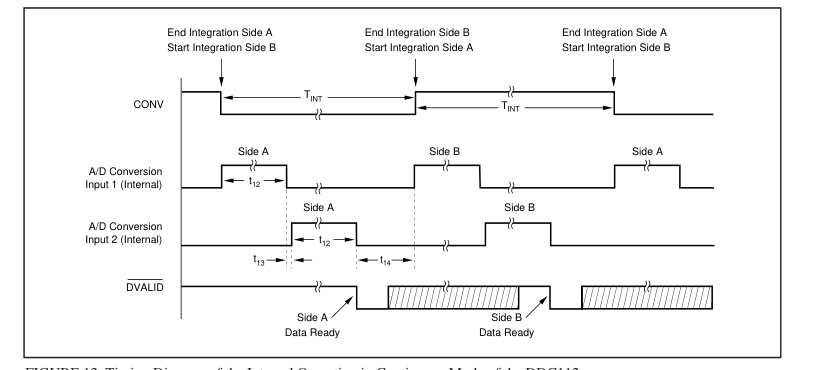
FIGURE 12. Timing Diagram of the Internal Operation in Continuous Mode of the DDC112.

TABLE VI. Timing for the Internal Operation in the Continuous Mode.
Page 14
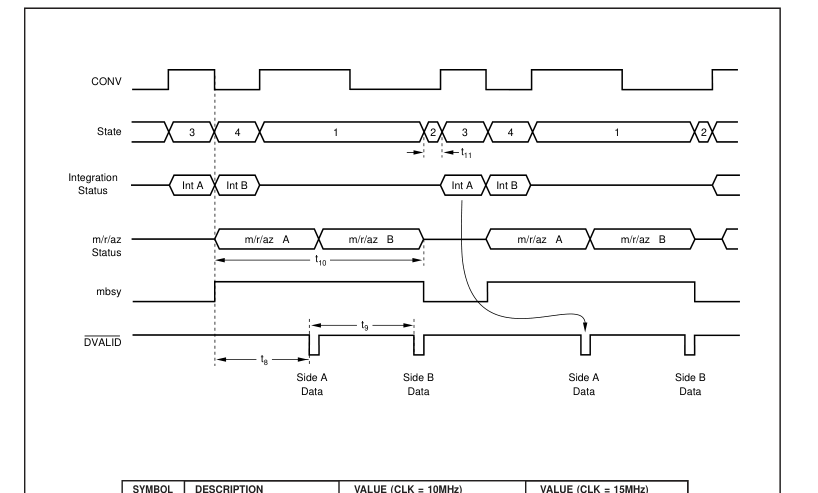
Ncont Mode Figure 13 illustrates operation in the ncont mode. The integrations come in pairs (i.e., sides A/B or sides B/A) followed by a time during which no integrations occur. During that time, the previous integrations are being measured, reset and auto-zeroed. Before the DDC112 can ad- vance to states 3 or 6, both sides A and B must be finished with the m/r/az cycle which takes time t10. When the m/r/az cycles are completed, time t11 is needed to prepare the next side for integration. This time is required for the ncont mode because the m/r/az cycle of the ncont mode is slightly different from that of the cont mode. After the first integration ends, DVALID goes LOW in time t8. This is the same
time as in the cont mode. The second data will be ready in time t9 after the first data is ready. One result of the naming convention used in this application bulletin is that when the DDC112 is operating in the “ncont mode”, it passes through both “ncont mode states” and “cont mode states”. For example, in Figure 13, the state pattern is 3, 4, 1, 2, 3, 4, 1, 2, 3, 4...where 3 and 4 are cont mode states. “Ncont mode” by definition means that for some portion of the time, neither side A nor B is integrating. States that perform an integration are labeled “cont mode states” while those that do not are called “ncont mode states”. Since integrations are performed in the ncont mode, just not continuously, some
cont mode states must be used in a ncont mode state pattern.
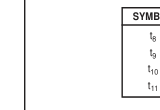
| SYMBOL | DESCRIPTION | VALUE (CLK = 10MHz) | VALUE (CLK = 15MHz) |
|---|---|---|---|
| t 8 t 9 t 10 t 11 | 1st ncont mode data ready 2nd ncont mode data ready Ncont mode m/r/az cycle Prepare side for integration | 421.2 ±0.3µs 4548.0µs 910.8µs ≥ 24.0µs | 280.5 ±0.2µs 3028.9µs 601.1µs ≥ 24.0µs |
FIGURE 13. Non-Continuous Mode Timing.
Page 15
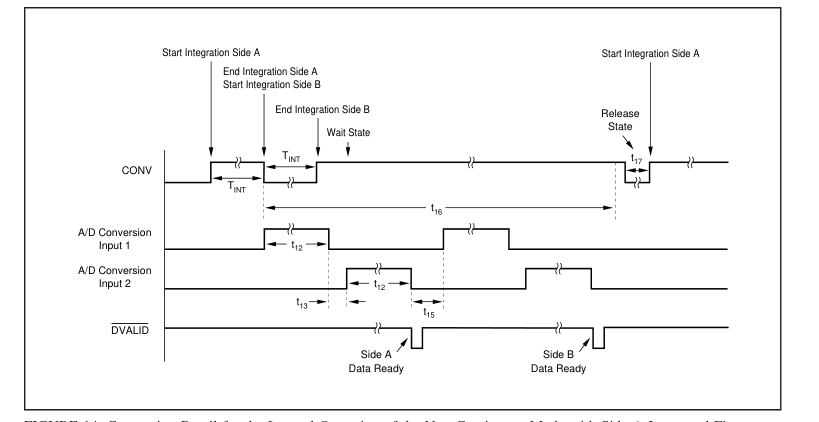
FIGURE 14. Conversion Detail for the Internal Operation of the Non-Continuous Mode with Side A Integrated First.
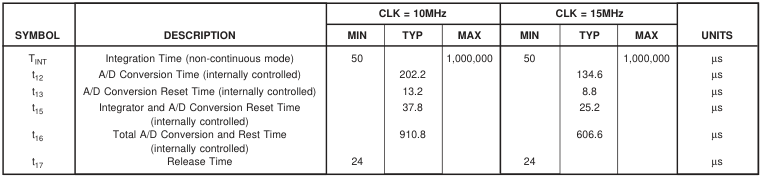
TABLE VII. Internal Timing for the DDC112 in the Non-Continuous Mode.
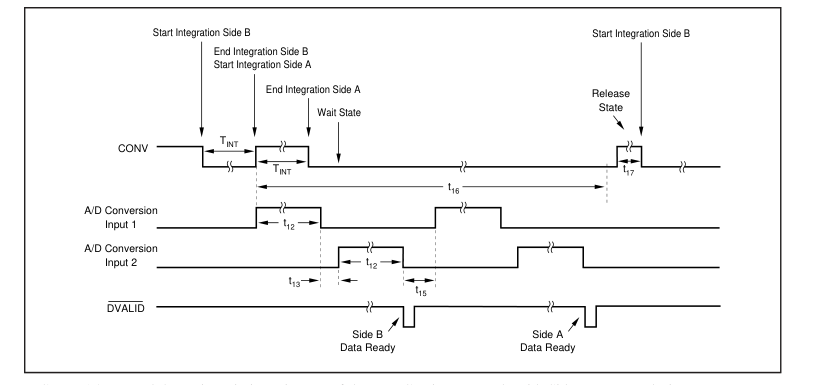
FIGURE 15. Internal Operation Timing Diagram of the Non-Continuous Mode with Side B Integrated First.
Page 16
Looking at the state diagram, one can see that the CONV pattern needed to generate a given state progression is not unique. Upon entering states 1 or 8, the DDC112 remains in those states until mbsy goes LOW, independent of CONV. As long as the m/r/az cycle is underway, the state machine ignores CONV (see Figure 9). The top two signals are different CONV patterns that produce the same state. This feature can be a little confusing at first, but it does allow flexibility in generating ncont mode CONV patterns. For example, the DDC112 Evaluation Fixture operates in the ncont mode by generating a square wave with pulse width < t6. Figure 17 illustrates operation in the ncont mode
using a 50% duty cycle CONV signal with TINT = 1620 CLK periods. Care must be exercised when using a square wave to generate CONV. There are certain integration times that must be avoided since they produce very short intervals for state 2 (or state 7 if CONV is inverted). As seen in the state diagram, the state progresses from 2 to 3 as soon as CONV is HIGH. The state machine does not insure that the duration of state 2 is long enough to properly prepare the next side for integration (t11). This must be done by the user with proper timing of CONV. For example, if CONV is a square wave with TINT = 3042 CLK periods, state 2 will only be 18 CLK periods long, therefore, t11 will not be met.
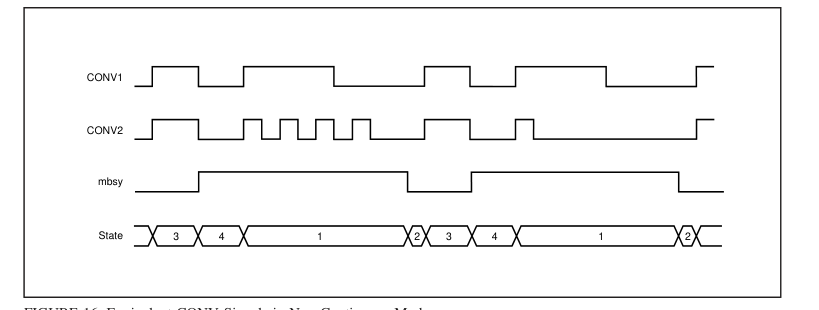
FIGURE 16. Equivalent CONV Signals in Non-Continuous Mode.
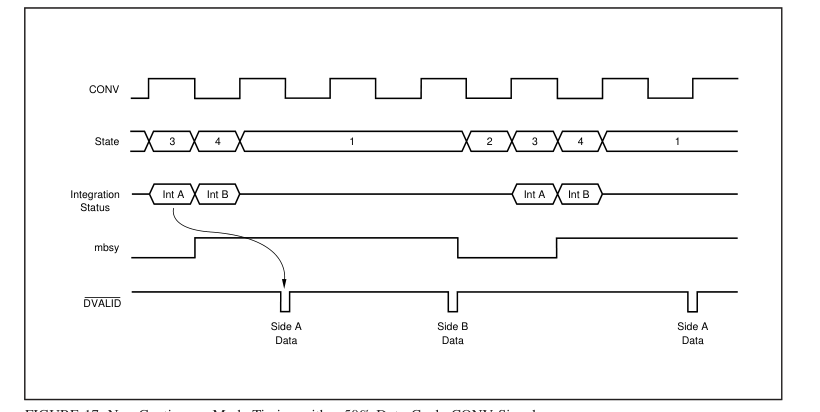
FIGURE 17. Non-Continuous Mode Timing with a 50% Duty Cycle CONV Signal.
Page 17
Changing Between Modes Changing from the cont to ncont mode occurs whenever TINT < t6. Figure 18 shows an example of this transition. In this figure, the cont mode is entered when the integration on side A is completed before the m/r/az cycle on side B is complete. The DDC112 completes the measurement on sides B and A during states 8 and 7 with the input signal shorted to ground. Ncont integration begins with state 6.
Changing from the ncont to cont mode occurs when TINT is increased so that TINT is always ≥ t6 (see Figure 14). With a longer TINT, the m/r/az cycle has enough time to finish before the next integration begins and continuous integration of the input signal is possible. For the special case of the very first integration when changing to the cont mode, TINT can be < t6. This is allowed because there is no simultaneous m/r/az cycle on the side B during state 3—there is no need to wait for it to finish before ending the integration on side A.
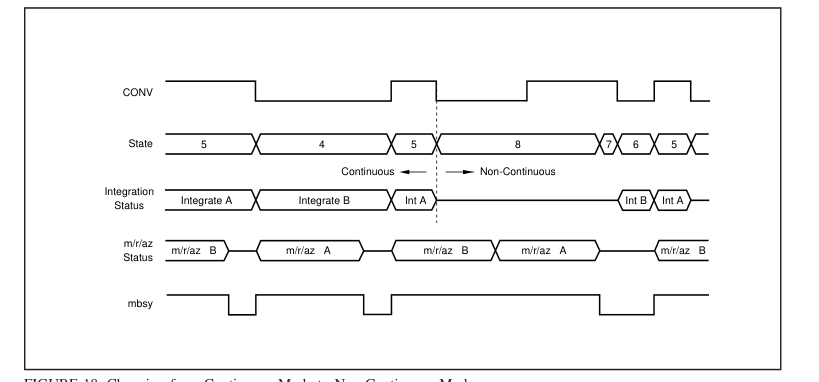
FIGURE 18. Changing from Continuous Mode to Non-Continuous Mode.
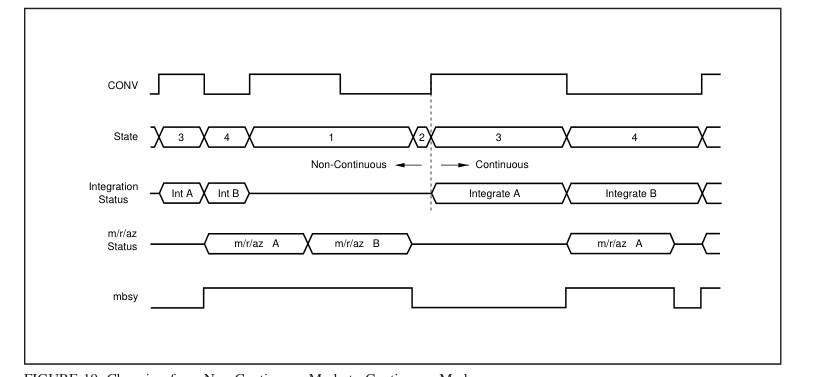
FIGURE 19. Changing from Non-Continuous Mode to Continuous Mode.
Page 18
SPECIAL CONSIDERATIONS
NCONT MODE INTEGRATION TIME
The DDC112 uses a relatively fast clock. For CLK = 10MHz, this allows TINT to be adjusted in steps of 100ns since CONV should be synchronized to CLK. However, for the internal measurement, reset and auto-zero operations, a slower clock is more efficient. The DDC112 divides CLK by six and uses this slower clock with a period of 600ns to run the m/r/az cycle and data ready logic. Because of the divider, it is possible for the integration time to be a non-integer number of slow clock periods. For example, if TINT = 5000 CLK periods (500µs for CLK = 10MHz), there will be 833 1/3 slow clocks in an integration period. This non-integer relationship between TINT and the slow
clock period causes the number of rising and falling slow clock edges within an integration period to change from integration to integration. The digital coupling of these edges to the integrators will in turn change from integration to integration which produces noise. The change in the clock edges is not random, but will repeat every 3 integrations. The coupling noise on the integrators appears as a tone with a frequency equal to the rate at which the coupling repeats. To avoid this problem in cont mode, the internal slow clock is shut down after the m/r/az cycle is complete when it is no longer needed. It starts up again just after the next integration begins. Since the slow clock is always off when CONV
toggles, the same number of slow clock edges fall within an integration period regardless of its length. Therefore, TINT ≥ 4794 CLK periods will not produce the coupling problem described above. For the ncont mode however, the slow clock must always be left running. The m/r/az cycle is not completed before an integration ends. It is then possible to have digital coupling to the integrators. The digital coupling noise depends heavily on the layout of the printed circuit board used for the DDC112. For solid grounds and power supplies with good bypassing, it is possible to greatly reduce the coupling. However, for guaranteeing the best performance in the ncont
mode, the integration time should be chosen to be an integer multiple of 1/(2fSLOWCLOCK). For CLK = 10MHz, the integration time should be an integer multiple of 300ns— TINT = 100µs is not. A better choice would be TINT = 99µs.
DATA READY
The DVALID signal which indicates that data is ready is generated using the internal slow clock. The phase relationship between this clock and CLK is set when power is first applied and is random. Since CONV is synchronized with CLK, it will have a random phase relationship with respect to the slow clock. When TINT > t6, the slow clock will temporarily shut down as described above. This shutdown process synchronizes the internal clock with CONV so that the time between when CONV toggles to when DVALID goes LOW (t7 and t8) is fixed.
For TINT ≤ t6, the internal slow clock, is not allowed to shut down and the synchronization never occurs. Therefore, the time between CONV toggling and DVALID indicating data is ready has uncertainty due to the random phase relationship between CONV and the slow clock. This variation is ±1/(2fSLOWCLOCK) or ±3/fCLK. The timing to the second DVALID in the ncont mode will not have a variation since it is triggered off the first data ready (t9) and both are derived from the slow clock. Polling DVALID to determine when data is ready eliminates any concern about the variation in timing since the readback is automatically adjusted as needed. If the data readback is
triggered off the toggling of CONV directly (instead of polling), then waiting the maximum value of t7 or t8 insures that data will always be ready before readback occurs. Data Retrieval In the continuous and non-continuous modes of operation, the data from the last conversion is available for retrieval with the falling edge of DVALID (see Figure 22). The falling edge of DXMIT in combination with the data clock (DCLK) will initiate the serial transmission of the data from the DDC112. Typically, data is retrieved from the DDC112 as soon as DVALID falls and completed before the next CONV transition from HIGH to LOW or LOW to HIGH occurs. If this is not the case, care should be taken to stop
activity on DCLK and consequently DOUT by at least 10µs around a CONV transition. If this caution is ignored it is possible that the integration that is being initiated by CONV will have additional noise introduced. The serial output data at DOUT is transmitted in Straight Binary Code per Table VIII. An output offset has been built into the DDC112 to allow for the measurement of input signals near and below zero. Board leakage up to ≈ –0.4% of the positive full scale can be tolerated before the digital output clips to all zeroes.
| CODE | INPUT SIGNAL |
| 1111 1111 1111 1111 1111 1111 1111 1111 1111 1110 0000 0001 0000 0000 0001 0000 0001 0000 0000 0000 0000 0000 0000 0000 0000 | FS FS – 1LSB +1LSB Zero –0.4% FS |
TABLE VIII. Straight Binary Code Table.
Cascading Multiple Converters Multiple DDC112 units can be connected in serial or parallel configurations, as illustrated in Figures 20 and 21. DOUT can be used with DIN to “daisy chain” several DDC112 devices together to minimize wiring. In this mode of operation, the serial data output is shifted through multiple DDC112s, as illustrated in Figure 20. RPULLUP prevents DIN from floating when DXMIT is HIGH. Care should be taken to keep the capacitive load on DOUT as low as possible when running CLK=15MHz.
Page 19
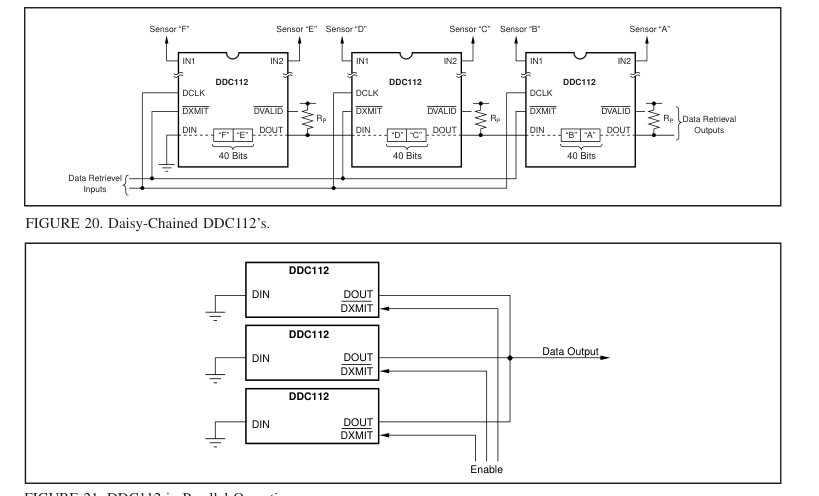
FIGURE 21. DDC112 in Parallel Operation.
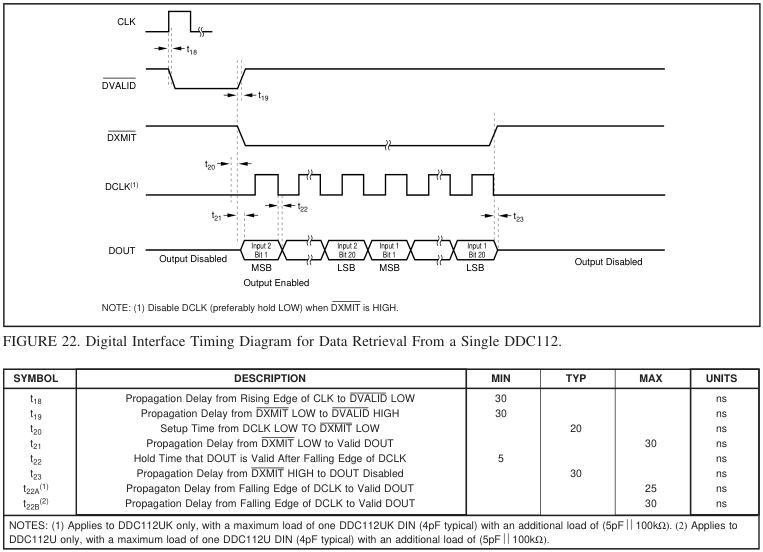
TABLE IX. Timing for the DDC112 Data Retrieval.
Page 20
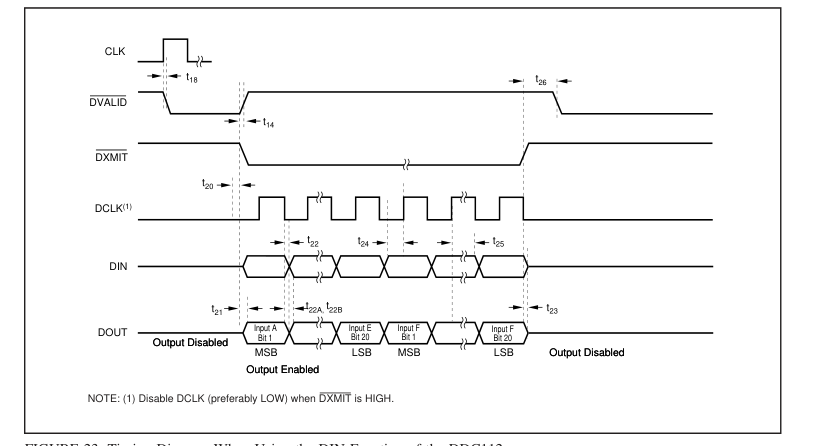
FIGURE 23. Timing Diagram When Using the DIN Function of the DDC112.

TABLE X. Timing for the DDC112 Data Retrieval Using DIN.
RETRIEVAL BEFORE CONV TOGGLES (CONTINUOUS MODE)
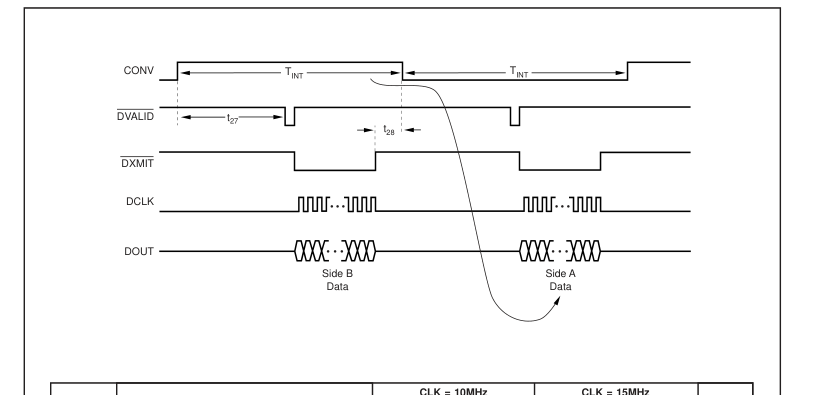
This is the most straightforward method. Data retrieval begins soon after DVALID goes LO and finishes before CONV toggles, see Figure 24. For best performance, data retrieval must stop t28 before CONV toggles. This method is the most appropriate for longer integration times. The maximum time available for readback is TINT – t27 – t28. For DCLK and CLK = 10MHz, the maximum number of DDC112s that can be daisy-chained together is:
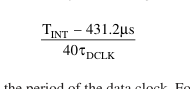
Where τDCLK is the period of the data clock. For example, if TINT = 100µs and DCLK = 10MHz, the maximum number of DDC112s is:
µs – 431 2 . s µ = 142 2 . DDC s →
(40 100 )( ns)
RETRIEVAL AFTER CONV TOGGLES
(CONTINUOUS MODE)
For shorter integration times, more time is available if data retrieval begins after CONV toggles and ends before the new data is ready. Data retrieval must wait t29 after CONV toggles before beginning. Figure 25 shows an example of this. The maximum time available for retrieval is t27 – t29 – t26 (421.2µs – 10µs –2µs for CLK = 10MHz), regardless of TINT. The maximum number of DDC112s that can be daisy-chained together is:
409 2 . µs 40τDCLK
For DCLK = 10MHz, the maximum number of DDC112s is 102.
Page 21
| SYMBOL | DESCRIPTION | CLK = 10MHz | CLK = 15MHz | UNITS | ||||
|---|---|---|---|---|---|---|---|---|
| MIN | TYP | MAX | MIN | TYP | MAX | |||
| t 27 t 28 | Cont Mode Data Ready Data Retrieval Shutdown Before Edge of CONV | 10 | 421.2 | 10 | 280.5 | µs µs | ||
FIGURE 24. Readback Before CONV Toggles.
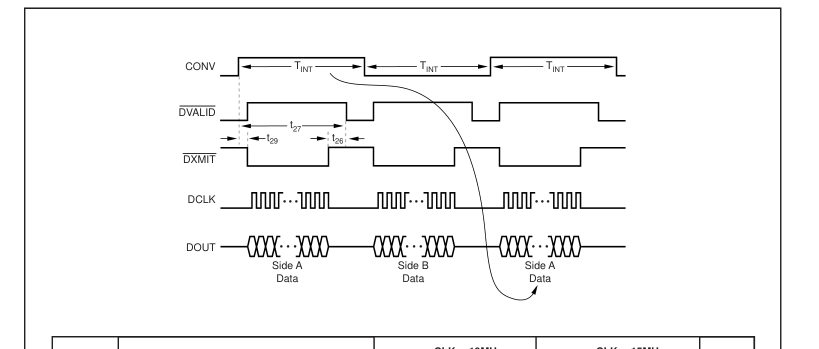

FIGURE 25. Readback After CONV Toggles.
Page 22
RETRIEVAL BEFORE AND AFTER CONV
TOGGLES (CONTINUOUS MODE) For the absolute maximum time for data retrieval, data can
be retrieved before and after CONV toggles. Nearly all of
TINT is available for data retrieval. Figure 26 illustrates how
this is done by combining the two previous methods. You
must pause the retrieval during CONV’s toggling to prevent
digital noise, as discussed previously, and finish before the
next data is ready. The maximum number of DDC112s that
can be daisy-chained together is:
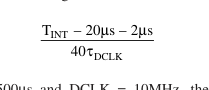
For TINT = 500µs and DCLK = 10MHz, the maximum
number of DDC112s is 119.
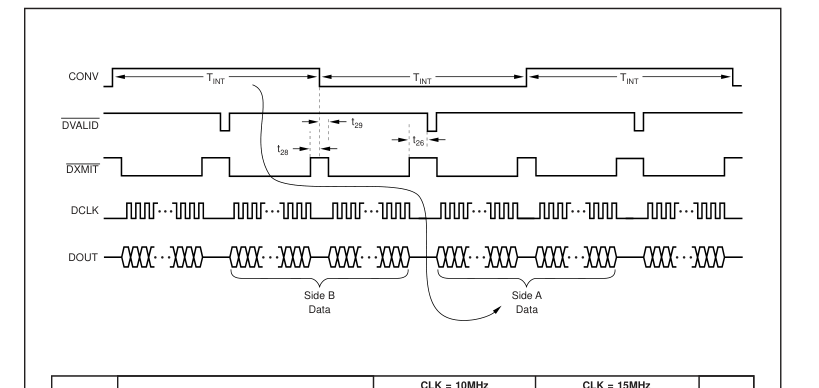

FIGURE 26. Readback Before and After CONV Toggles.
Page 23
RETRIEVAL: NONCONTINUOUS MODE
Retrieving in noncontinuous mode is slightly different as compared with the continuous mode. As shown in Figure 27 and described in detail in Application Bulletin AB-131, DVALID goes LOW in time t30 after the first integration completes. If TINT is shorter than this time, all of t31 is available to retrieve data before the other side’s data is ready. For TINT > t30, the first integration’s data is ready before the second integration completes. Data retrieval must be delayed until the second integration completes leaving less time available for retrieval. The time available is t31 – (TINT – t30). The second integration’s data must be retrieved before the next round of integrations begin. This
time is highly dependent on the pattern used to generate CONV. As with the continuous mode, data retrieval must halt before and after CONV toggles (t28, t29) and be completed before new data is ready (t26).
POWER-UP SEQUENCING
Prior to power-up, all digital and analog input pins must be LOW. At the time of power-up, these signal inputs can be biased to a voltage other than 0V, however, they should never exceed AVDD or DVDD. The level of CONV at powerup is used to determine which side (A or B) will be integrated first. Before integrations can begin though, CONV must toggle, as shown in Figure 28.
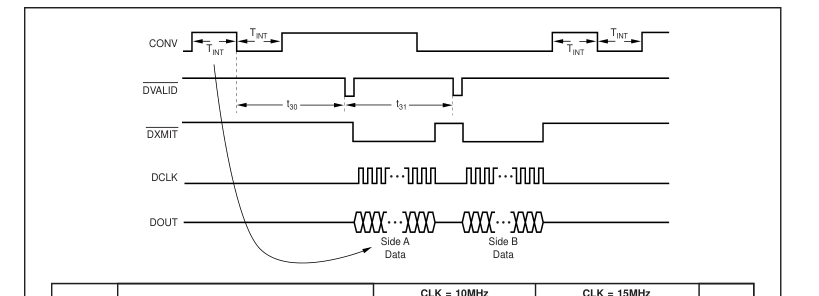

FIGURE 27. Readback in Noncontinuous Mode.
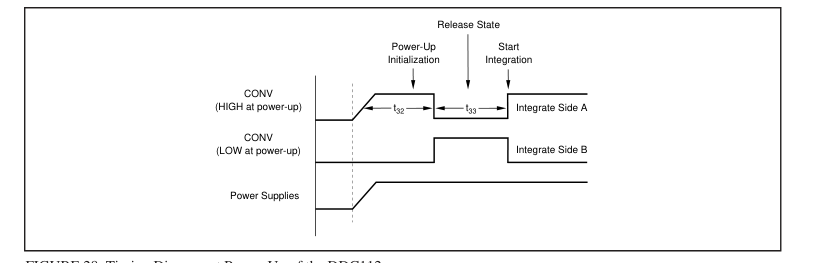
FIGURE 28. Timing Diagram at Power-Up of the DDC112.

TABLE XI. Timing for the DDC112 Power-Up Sequence.
Page 24
LAYOUT
Power Supplies and Grounding Both AVDD and DVDD should be as quiet as possible. It is particularly important to eliminate noise from AVDD that is non-synchronous with the DDC112 operation. Figure 29 illustrates two acceptable ways to supply power to the DDC112. The first case shows two separate +5V supplies for AVDD and DVDD. In this case, each +5V supply of the DDC112 should be bypassed with 10µF solid tantalum capacitors and 0.1µF ceramic capacitors. The second case shows the DVDD power supply derived from the AVDD supply with a < 10Ω isolation resistor. In both cases, the 0.1µF capacitors should be placed as close to the DDC112 package as possible. Shielding Analog Signal Paths
As with any precision circuit, careful printed circuit layout will ensure the best performance. It is essential to make short, direct interconnections and avoid stray wiring capacitance—particularly at the analog input pins. Digital signals
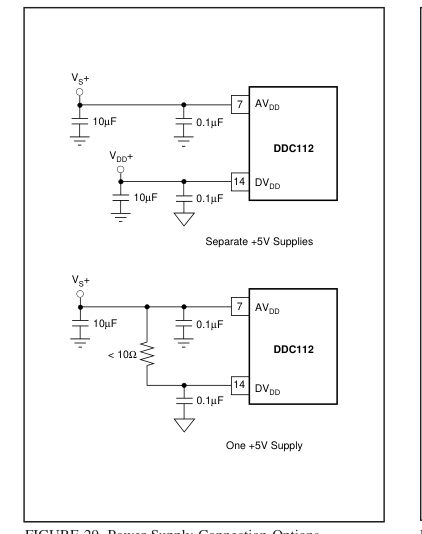
FIGURE 29. Power Supply Connection Options.
should be kept as far from the analog input signals as possible on the PC board. Input shielding practices should be taken into consideration when designing the circuit layout for the DDC112. The inputs to the DDC112 are high impedance and extremely sensitive to extraneous noise. Leakage currents between the PCB traces can exceed the input bias current of the DDC112 if shielding is not implemented. Figure 30 illustrates an acceptable approach to this problem. A PC ground plane is placed around the inputs of the DDC112 (pins 1 and 28). This shield helps minimize coupled noise into the input pins. Additionally, the pins that are used for the external integra-
tion capacitors (pins 3, 4, 5, 6, 23, 24, 25 and 26) should be guarded by a ground plane when the external capacitors are used. The approach above reduces leakage affects by surrounding these sensitive pins with a low impedance analog ground. Leakage currents from other portions of the circuit will flow harmlessly to the low impedance analog ground rather than into the analog input stage of the DDC112.
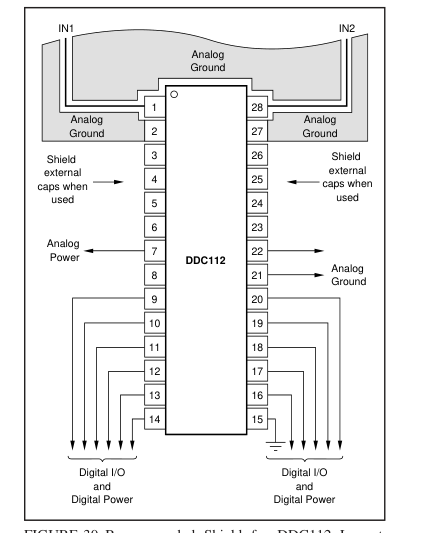
FIGURE 30. Recommended Shield for DDC112 Layout
Design.