
A5970AD.fm
Document overview
- Manufacturer or author: STMICROELECTRONICS
- PDF pages: 43
Technical content
Datasheet sections
- 1 Pin settings
- 1.1 Pin connection
- 1.2 Pin description
- 2 Electrical data
- 2.1 Maximum ratings
- 2.2 Thermal data
- 3 Electrical characteristics
- 4 Datasheet parameters over the temperature range
- 5 Functional description
- 5.1 Power supply and voltage reference
- 5.2 Voltages monitor
- 5.3 Oscillator and synchronization
- 5.4 Current protection
- 5.5 Error amplifier
- 5.6 PWM comparator and power stage
- 5.7 Inhibit function
- 5.8 Thermal shutdown
- 6 Additional features and protection
- 6.1 Feedback disconnection
- 6.2 Output overvoltage protection
- 6.3 Zero load
- 7 Closing the loop
- 7.1 Error amplifier and compensation network
- 7.2 LC filter
- 7.3 PWM comparator
- 8 Application information
Features
- Qualified following the AEC-Q100 requirements (see PPAP for more details)
- 1 A DC output current
- Operating input voltage from 4 V to 36 V
- 3.3 V / (± 2%) reference voltage
- Output voltage adjustable from 1.235 V to V IN
- Low dropout operation: 100% duty cycle
- 500 kHz Internally fixed frequency
- Voltage feed-forward
- Zero load current operation
- Internal current limiting
- Inhibit for zero current consumption
- Synchronization
- Protection against feedback disconnection
- Thermal shutdown Application
- Dedicated to automotive applications
Description
The A5970AD is a step-down monolithic power switching regulator with a minimum switch current limit of 1.35 A so it is able to deliver up to 1 A DC current to the load depending on the application conditions. The output voltage can be set from
1.235 V to V
IN . The device uses an internal P-channel DMOS transistor (with a typical R DS(on) of 250 m Ω ) as switching element to minimize the size of the external components. An internal oscillator fixes the switching frequency at 500 kHz. Having a minimum input voltage of
4 V only it fits the automotive applications
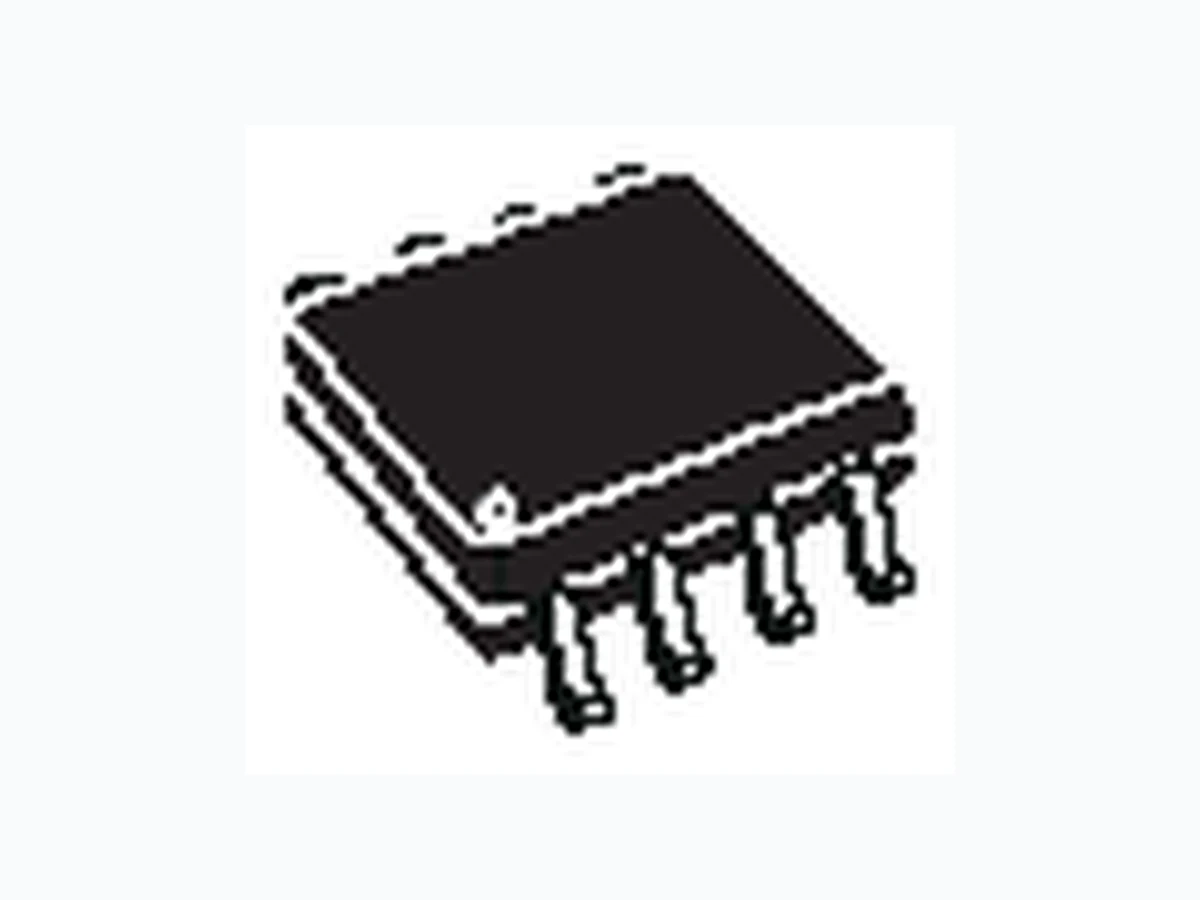
requiring the device operation even in cold crank conditions. Pulse by pulse current limit with the internal frequency modulation offers an effective constant current short-circuit protection. SO-8 Figure 1. Application schematic
1 Pin settings
1.1 Pin connection
Figure 2. Pin connection (top view)
1.2 Pin description
Table 1. Pin description 2 SYNCH Master/slave synchronization.
3 INH
4 COMP E/A output for frequency compensation. REF. No cap is requested for stability. 8 VCC Unregulated DC input voltage.
2 Electrical data
2.1 Maximum ratings
2.2 Thermal data
Table 2. Absolute maximum ratings 1 Maximum output current Int. limit. Table 3. Thermal data
- Package mounted on evaluation board.
3 Electrical characteristics
TJ = -40 °C to 125 °C, V CC = 12 V, unless otherwise specified. Table 4. Electrical characteristics
- With T J = 85 °C, I lim_min = 1.5 A, assured by design, characterization and st atistical correlation.
Table 4. Electrical characteristics (continued)
Datasheet parameters over the temperature range A5970AD
4 Datasheet parameters over the temperature range
The 100% of the population in the production flow is tested at three different ambient temperatures (-40 °C, +25 °C, +125 °C) to guarantee the datasheet parameters inside the junction temperature range (-40 °C, +125 °C). The device operation is so guaranteed when the junction temperature is inside the (-40 °C, +150 °C) temperature range. The designer can estimate the silicon temperature increase respect to the ambient temperature evaluating the internal power losses generated during the device operation (please refer to the Section 2.2 ). However the embedded thermal protection disables the switching activity to protect the device in case the junction temperature reaches the T SHTDWN (+150 °C ± 10 °C) temperature. All the datasheet parameters can be guaranteed to a maximum junction temperature of +125 °C to avoid triggering the thermal shutdown protection during the testing phase because of self-heating.
5 Functional description
- A voltage regulator supplying the internal circuitry. From this regulator, a 3.3 V reference voltage is externally available.
- A voltage monitor circuit which checks the input and the internal voltages.
- A fully integrated sawtooth oscillator with a frequency of 500 kHz ± 15%, including also the voltage feed forward function and an input/output synchronization pin.
- Two embedded current limitation circuits which control the current that flows through the power switch. The pulse-by-pulse current limit forces the power switch OFF cycle by cycle if the current reaches an internal threshold, while the frequency shifter reduces the switching frequency in order to significantly reduce the duty cycle.
- A transconductance error amplifier.
- A pulse width modulator (PWM) comparator and the relative logic circuitry necessary to drive the internal power.
- A high side driver for the internal P-MOS switch.
- An inhibit block for standby operation.
- A circuit to implement the thermal protection function.
Figure 3. Block diagram
5.1 Power supply and voltage reference
a very low supply voltage noise sensitivity.
5.2 Voltages monitor
Figure 4. Internal circuit
5.3 Oscillator and synchronization
Figure 5 shows the block diagram of the oscillator circuit. and is the input of the ramp generator and synchronizer blocks. signal. The device also has a synchronization pin which can work both as master and slave. Beating frequency noise is an issue when more than one voltage rail is on the same board. pin and the signal ground of the master device is suggested for its proper operation. VREF pin is required for this operation.
Figure 5. Oscillator circuit block diagram Figure 6. Synchronization example
5.4 Current protection
Figure 7 . The output power PDMOS transistor is split into two parallel PDMOS transistors.
Figure 7. Current limitation circuitry
5.5 Error amplifier
The error amplifier output is compared to the oscillator sawtooth to perform PWM control. Table 5. Uncompensated error amplifier characteristics
5.6 PWM comparator and power stage
generate the PWM signal for the driving stage. the faster the rise time, the lower the turn ON losses. However, there is a limit introduced by the recovery time of the recirculation diode.
- Spikes on the device supply voltage that cause oscillations (and thus noise) due to the board parasites.
- Turn ON overcurrent leads to a decrease in the efficiency and system reliability.
- Major EMI problems.
- Shorter freewheeling diode life. The fall time of the current during turn OFF is also critical, as it produces voltage spikes (due to the parasites elements of the board) that increase the voltage drop across the PDMOS. In order to minimize these problems, a new driving circuit topology has been used and the block diagram is shown in Figure 8 . The basic idea is to change the current levels used to turn the power switch ON and OFF, based on the PDMOS and the gate clamp status. This circuitry allows the power switch to be turned OFF and ON quickly and addresses the freewheeling diode recovery time problem. The gate clamp is necessary to ensure that V GS of the internal switch does not go higher than V GS max. The ON/OFF Control block protects against any cross conduction between the supply line and ground.
Figure 8. Driving circuitry
Functional description A5970AD
5.7 Inhibit function
The inhibit feature is used to put the device in standby mode. With the INH pin higher than 2.2 V the device is disabled and the power consumption is reduced to less than 100 µA. With the INH pin lower than 0.8 V, the device is enabled. If the INH pin is left floating, an internal pull up ensures that the voltage at the pin reaches the inhibit threshold and the device is disabled. The pin is also V CC compatible.
5.8 Thermal shutdown
The shutdown block generates a signal that turns OFF the power stage if the temperature of the chip goes higher than a fixed internal threshold (150 ± 10 °C). The sensing element of the chip is very close to the PDMOS area, ensuring fast and accurate temperature detection. A hysteresis of approximately 20 °C keeps the device from turning ON and OFF continuously.
A5970AD Additional features and protection
6 Additional features and protection
6.1 Feedback disconnection
If the feedback is disconnected, the duty cycle increases towards the maximum allowed value, bringing the output voltage close to the input supply. This condition could destroy the load. To avoid this hazardous condition, the device is turned OFF if the feedback pin is left floating.
6.2 Output overvoltage protection
Overvoltage protection, or OVP, is achieved by using an internal comparator connected to the feedback, which turns OFF the power stage when the OVP threshold is reached. This threshold is typically 30% higher than the feedback voltage. When a voltage divider is required to adjust the output voltage ( Figure 15 on page 27 ), the OVP intervention will be set at: Equation 1 Where R 1 is the resistor connected between the output voltage and the feedback pin, and R2 is between the feedback pin and ground.
6.3 Zero load
Due to the fact that the internal power is a PDMOS, no boostrap capacitor is required and so the device works properly even with no load at the output. In this case it works in burst mode, with a random burst repetition rate. VOVP 1.3 R1 R2+
7 Closing the loop
Figure 9. Block diagram of the loop
7.1 Error amplifier and compensation network
Figure 10. Error amplifier equivalent circuit and compensation network
whereas the zero is defined as: Equation 5 F P1 is the low frequency which sets the bandwidth, while the zero FZ1 is usually put near to the frequency of the double pole of the L-C filter (see below). FP2 is usually at a very high frequency.
7.2 LC filter
The transfer function of the L-C filter is given by: Equation 6 where R LOAD is defined as the ratio between V OUT and I OUT . If R LOAD >> ESR, the previous expression of A LC can be simplified and becomes: Equation 7 The zero of this transfer function is given by: Equation 8 F 0 is the zero introduced by the ESR of the output capacitor and it is very important to increase the phase margin of the loop. The poles of the transfer function can be calculated through the following expression: Equation 9 In the denominator of A LC the typical second order system equation can be recognized: Equation 10 FZ1 ALC s( ) RLOAD 1 ESR C OUT s••+( ) • s2 L C OUT ESR R LOAD +( ) s ESR C OUT • RLOAD L+•( ) RLOAD +•+••• ALC s( )
1 ESR C OUT • s•+
L C OUT • s2 ESR C OUT • s 1 +•+• FO FPLC1 2 , ESR C OUT ESR C OUT •( ) 2 4 L • COUT •–±•– s2 2 δ • ω n• s ω 2 n+•+
If the damping coefficient δ is very close to zero, the roots of the equation become a double root whose value is ω n. Similarly for A LC the poles can usually be defined as a double pole whose value is: Equation 11
7.3 PWM comparator
The PWM gain is given by the following formula: Equation 12 where V OSCMAX is the maximum value of a sawtooth waveform and VOSCMIN is the minimum value. A voltage feed forward is implemented to ensure a constant GPWM. This is obtained by generating a sawtooth waveform directly proportional to the input voltage V CC . Equation 13 Where K is equal to 0.038. Therefore the PWM gain is also equal to: Equation 14 This means that even if the input voltage changes, the error amplifier does not change its value to keep the loop in regulation, thus ensuring a better line regulation and line transient response. In summary, the open loop gain can be expressed as: Equation 15 FPLC 2 π • L C OUT •• GPWM s( ) Vcc VOSCMAX VOSCMIN – K V CC •= GPWM s( ) 1 K- - - - const = = G s ( ) GPWM s( )
8 Application information
8.1 Component selection
- Input capacitor The input capacitor must be able to support the maximum input operating voltage and the maximum RMS input current. Since step-down converters draw current from the input in pulses, the input current is squared and the height of each pulse is equal to the output current. The input capacitor has to absorb all this switching current, which can be up to the load current divided by two (worst case, with duty cycle of 50%). For this reason, the quality of these capacitors has to be very high to minimize the power dissipation generated by the internal ESR, thereby improving system reliability and efficiency. The critical parameter is usually the RMS current rating, which must be higher than the RMS input current. The maximum RMS input current (flowing through the input capacitor) is: Equation 17 Where η is the expected system efficiency, D is the duty cycle and IO is the output DC current. This function reaches its maximum value at D = 0.5 and the equivalent RMS current is equal to I O divided by 2 (considering η = 1). The maximum and minimum duty cycles are: Equation 18 and Equation 19 Where V F is the freewheeling diode forward voltage and VSW the voltage drop across the internal PDMOS. Considering the range D MIN to D MAX , it is possible to determine the max. IRMS going through the input capacitor. IRMS IO D 2 D 2• DMAX VOUT VF+ DMIN VOUT VF+
physically larger than other capacitors. a higher RMS current rating for a given physical dimension (due to very low ESR). The drawback is the considerably high cost. Very good, small tantalum capacitors with very low ESR are becoming more available. However, they can occasionally burn if subjected to very high current during charge. Therefore, it is better to avoid this type of capacitor for the input filter of the device. pins is always suggested to adequately filter VCC spikes.
- Output capacitor The output capacitor is very important to meet the output voltage ripple requirement. Using a small inductor value is useful to reduce the size of the choke but it increases the current ripple. So, to reduce the output voltage ripple, a low ESR capacitor is required. Nevertheless, the ESR of the output capacitor introduces a zero in the open loop gain, which helps to increase the phase margin of the system. If the zero goes to a very high frequency, its effect is negligible. For this reason, ceramic capacitors and very low ESR capacitors in general should be avoided. Tantalum and electrolytic capacitors are usually a good choice for this purpose. A list of some tantalum capacitor manufacturers is provided in Table 7.: Output capacitor selection .
Table 6. List of ceramic capacitors for the A5970AD
- Inductor The inductor value is very important as it fixes the ripple current flowing through the output capacitor. The ripple current is usually fixed at 20 - 40% of I omax , which is 0.2 - 0.4 A with IOmax = 1 A. The approximate inductor value is obtained using the following formula: Equation 20 where T ON is the ON time of the internal switch, given by D · T. For example, with VOUT = 3.3 V, V IN = 12 V and ΔIO = 0.3 A, the inductor value is about 15 µH. The pea k current through the inductor is given by: Equation 21 and it can be observed that if the inductor value decreases, the peak current (which must be lower than the current limit of the device) increases. So, when the peak current is fixed, a higher inductor value allows a higher value for the output current. In Table 8 some inductor manufacturers are listed.
Table 7. Output capacitor selection
- POSCAP capacitors have some characteristics which are very similar to tantalum.
Table 8. Inductor selection
8.2 Layout considerations
Figure 13. Layout example
8.3 Thermal considerations
- Conduction losses due to the not insignificant R DSON , which are equal to: Equation 22 Where D is the duty cycle of the application. Note that the duty cycle is theoretically given by the ratio between V OUT and V IN , but in practice it is substantially higher than this value to compensate for the losses in the overall application. For this reason, the switching losses related to the R DSON increases compared to an ideal case. A5970AD PON RDSON IOUT ( ) • 2 D•=
- Switching losses due to turning ON and OFF. These are derived using the following equation: Equation 23 Where T RISE and TFALL represent the switching times of the power element that cause the switching losses when driving an inductive load (see Figure 14 ). TSW is the equivalent switching time.
Figure 14. Switching losses
- Quiescent current losses. Equation 24 Where I Q is the quiescent current. Example 2 :
- VIN = 12 V
- VOUT = 3.3 V
- IOUT = 0.8 A RDS(on) has a typical value of 0.25 at 25 °C and increases up to a maximum value of 0.5. at 150 °C. We can consider a value of 0.4 Ω . TSW is approximately 70 ns. IQ has a typical value of 2.7 mA at V IN = 12 V. The overall losses are: Equation 25 PSW VIN IOUT TON TOFF +( ) PQ VIN IQ•= PTOT RDSON IOUT ( ) • 2 D V IN IOUT • TSW • FSW VIN IQ=•+•+•=
Application information A5970AD The junction temperature of device will be: Equation 26 Where T A is the ambient temperature and Rth J-A is the thermal resistance junction to ambient. Considering that the device is mounted on board with a good ground plane, that it has a thermal resistance junction to ambient (Rth J-A ) of about 120°C/W, and an ambient temperature of about 50 °C: Equation 27
8.4 Short-circuit protection
In overcurrent protection mode, when the peak current reaches the current limit, the device reduces the T ON down to its minimum value (approximately 250 nsec) and the switching frequency to approximately one third of its nominal value even when synchronized to an external signal (see Section 5.4: Current protection on page 11 ). In these conditions, the duty cycle is strongly reduced and, in most applications, this is enough to limit the current to ILIM. In any event, in case of heavy short-circuit at the output (V O = 0 V) and depending on the application conditions (V cc value and parasitic effect of external components) the current peak could reach values higher than ILIM. This can be understood considering the inductor current ripple during the ON and OFF phases:
- ON phase Equation 28
- OFF phase Equation 29 where V D is the voltage drop across the diode, DCR L is the series resistance of the inductor. In short-circuit conditions V OUT is negligible so during T OFF the voltage across the inductor is very small as equal to the voltage drop across parasitic components (typically the DCR of the inductor and the V FW of the free wheeling diode) while during T ON the voltage applied the inductor is instead maximized as approximately equal to V IN . So the Equation 28 and the Equation 29 in overcurrent conditions can be simplified to: Equation 30 considering T ON that has been already reduced to its minimum. TJ TA Rth J A – PTOT •+= TJ 50 0.55 120 116 °C≅•+= IL TON Δ VIN Vout – DCR L RDSON +( ) I⋅– IL TOFF Δ VD Vout DCR L I•+ + ( ) – IL TON Δ VIN DCR L RDSON +( ) I⋅– VIN
Figure 17. Short-circuit current V IN = 36 V
8.5 Application circuit
due to the voltage rating of the output capacitor. Figure 18. Evaluation board application circuit Table 9. Component list
8.6 Positive buck-boost regulator
The device can be used to implement a step-up/down converter with a positive output voltage. The output voltage is given by: Equation 32 where the ideal duty cycle D for the buck boost converter is: Equation 33 However, due to power losses in the passive elements, the real duty cycle is always higher than this. The real value (that can be measured in the application) should be used in the following formulas. The peak current flowing in the embedded switch is: Equation 34 while its average current is equal to: Equation 35 This is due to the fact that the current flowing through the internal power switch is delivered to the output only during the OFF phase. The switch peak current must be lower than the minimum current limit of the overcurrent protection (see Table 4 on page 6 for details) while the average current must be lower than the rated DC current of the device. As a consequence, the maximum output current is: Equation 36 where I SW MAX represents the rated current of the device. The current capability is reduced by the term (1 - D) and so, for example, with a duty cycle of 0.5, and considering an average current through the switch of 1 A, the maximum output current deliverable to the load is 0.5 A. VOUT VIN D D VOUT ISW ILOAD IRIPPLE ILOAD VIN fSW ISW ILOAD IOUT MAX ISW MAX 1 D –( ) ⋅≅
8.7 Negative buck-boost regulator
Section 8.6 for the real duty cycle are still valid here. Also the Equation 34 till Equation 36 can be used to calculate the maximum output current. IN - VO, which must be lower than 36 V (the maximum operating input voltage). Figure 23. Negative buck-boost regulator
8.8 Synchronization example
See Section 5.3: Oscillator and synchronization on page 10 for details. Figure 24. Synchronization example
8.9 Compensation network with MLCC at the output
the output filter in order to reduce the voltage ripple and the overall size of the application. with this compensation is limited.
8.10 External SOFT_START network
up to an external reference through R and the BJT clamps the COMP pin. This clamps the duty cycle, limiting the slew rate of the output voltage. Figure 26. Soft-start network example
9 Typical characteristics
Figure 27. Load regulation Figure 28. Line regulatio n Figure 29. Output voltage vs. junction Figure 30. Shutdown current vs. junction
specifications, grade definitions and product status are available at: www.st.com . Figure 35. SO-8 package outline
Table 10. SO-8 package mechanical data
- Dimensions D does not include mold flash, protrus ions or gate burrs. Mold flash, protrusions or gate burrs
shall not exceed 0.15 mm (0.006 inch) in total (bot h sides).
Table 11. Ordering information
Table 12. Document revision history Figure 28, Figure 29 and Figure 30 on page 37. order of Figure 35 and Table 10, updated titles, minor modifications). Updated cross-references throughout document. Minor modifications throughout document.