
DATASHEET SEARCH SITE
Document overview
- Manufacturer or author: Provided By www.digicamel.com(FREE DATASHEET DOWNLOAD SITE)
- PDF pages: 17
Technical content
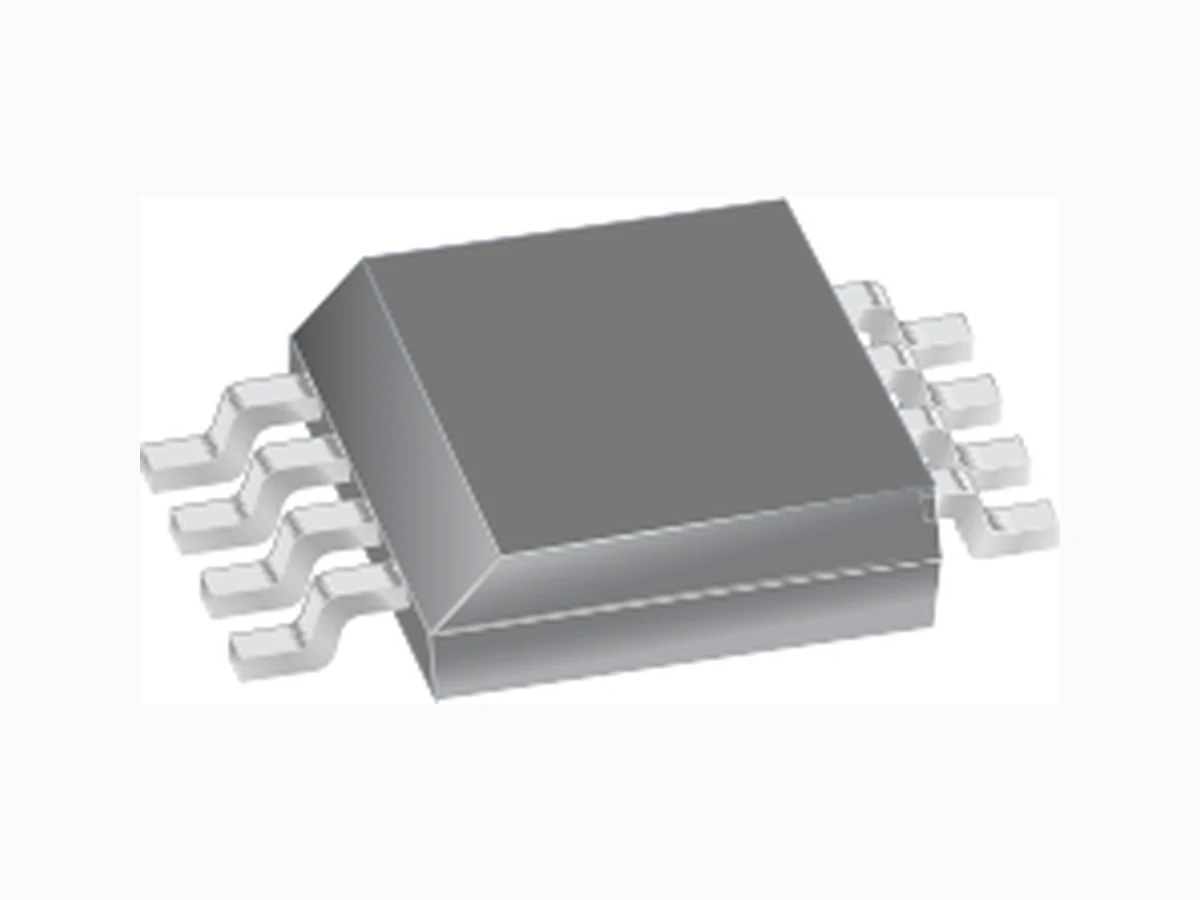
Approximate Scale 1:1 A4401
Description
This device provides all the necessary control functions to provide the power rails for driving a vacuum fluorescent display (VFD) using minimal external components. The power supply is based on a quasi-resonant, discontinuous flyback converter, operating near the critical conduction boundary. A novel adaptive turn-on control scheme is used to optimize the turn-on and turn-off phase of the MOSFET, to reduce EMI emissions while minimizing switching losses. The converter is self-oscillating, operating at switching frequencies depending on the input voltage, load, and external components. An onboard linear regulator that is powered directly from the battery provides the housekeeping supply, avoiding the need for complex bias supplies. Internal diagnostics provide comprehensive protection against overloads, input undervoltage, and overtemperature conditions. The A4401 is supplied in an 8-pin narrow SOIC package (suffix L), which is lead (Pb) free, with 100% matte-tin leadframe plating. A4401-DS, Rev. 2 Features and Benefits ▪ Multiple output regulator ▪ 7 to 40 V input supply ▪ Low EMI conducted and radiated emissions ▪ Adaptive quasi-resonant turn on/off control ▪ Minimal number of external components ▪ Enable input which can be driven with respect to the battery voltage Automotive Quasi-Resonant Flyback Control IC Package: 8-pin narrow SOIC (suffix L) Typical Application ECU GD VFD LX EN A4401 +VBAT ISS 0 V 0 V VA VIN COMPGND
Automotive Quasi-Resonant Flyback Control ICA4401 2Allegro MicroSystems, Inc.
115 Northeast Cutoff, Box 15036
Worcester, Massachusetts 01615-0036 (508) 853-5000 www.allegromicro.com Selection Guide Part Number Packing A4401KLTR-T Tape and reel, 3000 pieces/reel Absolute Maximum Ratings* Characteristic Symbol Notes Rating Units VIN Pin Voltage V IN –0.3 to 40 V LX Pin Voltage V LX –0.6 to 60 V ISS Pin Voltage V ISS –1 to 1 V EN Pin Voltage V EN –0.3 to 40 V VA Pin Voltage V VA –0.3 to 5 V ESD Rating – Human Body Model AEC-Q100-002; all pins 2000 V ESD Rating – Charged Device Model AEC-Q100-011; all pins; inside 500 V AEC-Q100-011; all pins; corner 750 V Operating Ambient Temperature T A Range K –40 to 125 ºC Junction Temperature T J –40 to 150 ºC Storage Temperature T stg –55 to 150 ºC * With respect to ground Characteristic Symbol Test Conditions* Value Units Package Thermal Resistance R θJA 4-layer PCB based on JEDEC standard 80 ºC/W *Additional thermal information available on Allegro website.
Automotive Quasi-Resonant Flyback Control ICA4401 3Allegro MicroSystems, Inc. Worcester, Massachusetts 01615-0036 (508) 853-5000 www.allegromicro.com Functional Block Diagram VIN LX GD ISS EN COMP VA GND Pin-out Diagram Number Name Description
1 EN Enable input; active high
2 COMP Compensation node for Gm amplifier stage
3 VA Output voltage feedback input
4 GND Ground reference connection; connect to negative terminal of battery supply
5 ISS MOSFET, Q1, current sense input
6 GD MOSFET gate drive output
7 LX Regulator switching node: MOSFET drive output
8 VIN Supply input to power control circuit, MOSFET driver, and reference voltages
R S ISS Optional EMI Filter Linear Ref.Soft Start Gm Amp Enable 10 kΩ 220 kΩ 6.8 nF 1 MΩ 0.100 Ω 330 kΩ 4.7 kΩ 10 kΩ
4.7 V 100 nF
2.2 nF Optional feedback resistor 27 kΩ 220 pF
Automotive Quasi-Resonant Flyback Control ICA4401 4Allegro MicroSystems, Inc. Worcester, Massachusetts 01615-0036 (508) 853-5000 www.allegromicro.com ELECTRICAL CHARACTERISTICS1,2 valid at TJ = –40°C to +150°C, VIN = 7 to 40 V (unless noted otherwise) Characteristics Symbol Test Conditions Min. Typ. Max. Units General VIN Quiescent Current IINOFF EN = Low – – 10 μA IINON EN = High, no MOSFET switching – 2.3 3.3 mA LX Leakage Current I LXLEAK EN = Low, VLX = 40 V – – 1 μA LX Input Bias Current I LX EN = High, VLX = 60 V – – 145 μA Minimum Frequency f SW 25 35 45 kHz Soft Start t SS 51 01 5 m s Gate Drive Drive High Voltage, VIN > 10 V VGDH – 8.4 9.5 V Drive High Voltage, 10 V > VIN > 7 V – V IN – 0.5 V IN – 0.25 V Rise Time, VIN > 10 V tr CLOAD = 1 nF, 10% to 90% of VGS= 9 V – 60 – ns Rise Time, 10 V > VIN > 7 V C LOAD = 1 nF, 10% to 90% of VGS , VIN = 7 V – 90 – ns Fall Time, VIN > 10 V tf CLOAD = 1 nF, 90% to 10% of VGS = 0 V – 30 – ns Fall Time, 10 V > VIN > 7 V C LOAD = 1 nF, 90% to 10% of VGS , VIN = 7 V – 40 – ns Current Sense Input Maximum Sense Voltage (Current Limit) V CL 600 800 1000 mV Sense Input Bias Current I ISS VISS = –300 mV to 1 V – – 10 μA Current Sense Blanking t BLANK 100 145 190 ns Reference Supply Reference Voltage Tolerance V REF 1.180 1.205 1.230 V Operational Transconductance Amplifier Output Impedance Z OP 10 – – M Ω Gm Constant3 KGm – 470 – μS Output Source Current I SRC VCOMP = 1.4 V, VA = 1.06 V, TA = 25ºC –30 –25 –20 μA Output Sink Current I SIN VCOMP = 1.4 V, VA= 1.36 V, TA = 25ºC 20 25 30 μA Input Bias Current I BIAS – –100 – nA Enable Input EN Input Low Voltage V IL – – 0.8 V EN Input High Voltage V IH 2.4 – – V EN Input Hysteresis V Ihys 200 500 – mV EN Input Current IINL VIN = 0 V –10 – 10 μA IINH VIN = 14 V – – 50 μA VIN = 40 V – – 200 μA Protection VIN Turn-On Threshold V UVON Voltage rising 5.4 – 7 V VIN Turn-Off Threshold V UVOFF Voltage falling 4.9 – 6.5 V Undervoltage Hysteresis V UVhys – 0.5 – V Overtemperature Shutdown T JSD Temperature increasing – 165 – ºC Overtemperature Hysteresis T JSDhys –1 5 – º C 1For input and output current specifications, negative current is defined as coming out of (sourcing) the specified device pin. 2Specifications over operating temperature range are assured by design and characterization. 3Guaranteed by design.
rectification (SR) latch and turns off the MOSFET. capacitance appearing between the drain and ground. relatively slow resonant dV/dt helps to reduce EMI. Electromagnetic Interference section. the converter will enter a burst mode of operation. ing regulation of the outputs. Figure 1. External MOSFET voltage and current
Automotive Quasi-Resonant Flyback Control ICA4401 6Allegro MicroSystems, Inc. Worcester, Massachusetts 01615-0036 (508) 853-5000 www.allegromicro.com In the event of an overload, the current demand signal produced by the Gm amplifier restricts the output cur- rent by introducing pulse-by-pulse current limiting. Regulation Voltage The feedback resistors, R5 and R6, determine the voltage of the output rail to which they are connected, according to the following formula: VREF ×(R5 + R6) R6VOUT = , (1) where R6 should be approximately 5 kΩ. The internal 1.2 V reference has a ±2% worst case tolerance, plus there is an input bias current, IBIAS, on the feedback node, V A, that has a small influence. This current flows into the ground referenced resistor, R6, creating a small voltage offset. In applications where the main control output (anode or grid) can run at relatively light loads (relative to the filament load), it may be necessary to “mix” the feed- back signal. This involves adding an additional feed- back from the filament output to the V A input. Note that this only applies to DC filament outputs. R3 Current Sense Resistor Selection To determine the resistance value, the maximum peak current needs to be determined. First determine the average input current, I AV , as follows: POUT(max) H% × VIN(max)IAV = , (2) where POUT is the output power. Then, the peak cur- rent through the sense resistor: D(max) 2 × IAVIPK = , (3) where D is limited to 0.7, or can be precisely found as described in the Magnetics Design section. Note that a D of 0.7 is chosen in order to achieve 0 V switching with a V BAT of 13.5 V . To determine the sense resistor value, assume that the minimum sense voltage before current limiting occurs is 600 mV . A reasonable maximum voltage to select during normal operation would be 500 mV . Then, the resistor value can be found as follows: IPK 500 mVRSENSE = . (4) The power losses in the resistor can be found by first determining the rms current through it: ½D(max)IRMS = IPK × .⎟⎟ (5) Then, the losses in sense resistor are: PRDS =I ²RMS × RSENSE . (6) The power rating of the resistor can be selected based on the power dissipation. When selecting a resistor it is worth noting that the maximum power rating is valid up to 70°C and derates linearly to 0 W at a temperature of typically between 120°C and 140°C. Check the resistor manufacturer guidelines. Note that is imperative that this resistor be a low inductance type; avoid wire wound. Standard surface mount devices are usually acceptable. Soft Start When power is initially applied, assuming the input voltage turn-on threshold is reached, and the EN input is enabled, the controller is initiated and the MOSFET, Q1, is turned on for the first switching cycle. Initially, while the output volts are rising towards the target reg- ulation point set by the soft start circuit, the MOSFET will run at current limit. During a soft start cycle, the reference voltage is ramped from 0 to 1.2 V in 32 steps over a period of 10 ms under the control of a DAC. This forces the output of the amplifier to vary between 0.8 and 1.5 V , which in turn reduces the effects of inrush current and volt- age overshoot on the outputs.
circuit has to be capable of sinking at least 30 μA. manufacturers will provide this information.
6.5 V × 1 nF
DS is calculated in the next section. Figure 2. MOSFET, Q1, loss approximations
Automotive Quasi-Resonant Flyback Control ICA4401 8Allegro MicroSystems, Inc. Worcester, Massachusetts 01615-0036 (508) 853-5000 www.allegromicro.com Switching Turn-On Losses The turn-on losses are determined by the amount of energy the resonant capacitor, C11, has to discharge into the MOSFET. At low battery voltage, the resonant swing should force the volts across the capacitor to only a few volts, mak- ing this loss negligible. Total Losses The total MOSFET power loss can be estimated as follows: PTOTAL PSTATIC + PTURNOFF= . (11) The thermal resistance, RθJA, can be determined by two methods. One is by estimating a maximum junc- tion temperature, T J(max). The other is to test for the operating junction temperature, using the given device package mounted on a printed circuit board with cop- per trace area connected to the device. R θJA is then calculated as follows: PTOTAL TJ – TARθJA = . (12) The drain-to-source rating, VDS , is the sum of the maximum input voltage, VBAT (max), plus the reflected output voltage. Adequate margin should also be added, to allow for tolerancing effects and parasitic voltage ring. It can be calculated as follows: NOUT NPVDS VOUT ×+ VBAT (max)= .⎟⎟ (13) D2, D3, and D4 Output Diodes Selection For the low voltage outputs such as the filament sup- ply, it is recommended that a Schottky diode be used. For the higher voltage rails, ultrafast rectifier diodes are recommended. For each output, estimate the maximum reverse volt- age, V RRM, and the maximum average current that the diode is subjected to. The VRRM rating should exceed at least 20% of the maximum VDIODE voltage, calcu- lated as follows: NP NS1VDIODE + VOUT VBAT (max) ×= . (14) The maximum average current through the diode is simply the maximum load current. The diode should be rated to handle this current with some margin. In addition, the diode should be able to handle the power dissipation. The majority of the power loss is simply the static loss: PSTATIC Vf × ILOAD= . (15) The forward voltage drop, Vf , can be found from the diode characteristics at maximum load. C1 Input Capacitor Selection In the interests of cost and performance, it is recom- mended that ultralow impedance electrolytic capaci- tors be used. The ratio of the source impedance to the impedance of the input capacitor will determine how much of the input current is drawn from the input capacitor. For example, if the source impedance is relatively high, then the input capacitor would have to supply the triangular current that flows through the primary winding, the MOSFET Q1, and the current sense resistor. This rms current was worked out in the Current Sense Resistor Selection section. Electrolytic capacitors experience heating effects caused by the rms current flowing through the ESR of the device. The maximum rms current is normally quoted at 100 kHz and 105°C. Frequency correc- tion factors for the ripple current are provided when the operating frequencies are less than 100 kHz. A
50 VDC rating should be adequate for most applica-
tions. C4, C6, and C8 Output Capacitors Selection The overall equivalent capacitance on the output should not be less 22 μF (see Control Loop section
Automotive Quasi-Resonant Flyback Control ICA4401 9Allegro MicroSystems, Inc. Worcester, Massachusetts 01615-0036 (508) 853-5000 www.allegromicro.com for more information). The current that flows in and out of the capacitor is similar to the current that flows through the corresponding rectifier diode. Worst case power dissipation due to the ESR will occur at V BAT(min) and maximum load. The duty cycle under these conditions is a maximum of 0.7. The rms current in the capacitor can be found as fol- lows: ½0.7IRMS = 4 × ILOAD × .⎟⎟ (16) When selecting a suitable capacitor, the rms current rating should have reasonable margin with respect to the above value. In addition, the current rating should be derated to take into account the frequency correc- tion at values of less than 100 kHz. The impedance of the output capacitor will affect the amount of voltage ripple and noise that appears on the output. The impedance is composed of two com- ponents: ESR and reactance, X C. Even with a modest amount of capacitance on the output, the ESR will tend to dominate the overall impedance. The ESR can be estimated by multiplying the capaci- tance reactance by the dissipation factor, DF (tan δ): 1ESR = × DF2 × × fSW × COUT (17) Note that DF is normally quoted at 25°C, however, it is usually fairly constant as the temperature is increased. The peak to peak voltage can then be found: Vpk-pk = ESR × ILOAD × 4 . (18) The voltage rating should be chosen to provide at least a 20% margin above the maximum output voltage. Control Loop As the converter operates in discontinuous mode, the inductor does not feature in the power stage. The power stage effectively contains one pole formed by the output capacitors and loads. In terms of “closing the loop,” the optimal shaping components are shown in the Functional Block dia- gram, connected to the COMP pin. The control loop is optimized for an equivalent output capacitor of 22 μF. Larger capacitor values can be used, however, those will tend to reduce the bandwidth of the control loop. Smaller values should not be used, as they may cause instability issues. Magnetics Design The following are the known variables:
- Maximum output power, POUT .
- Minimum battery voltage, VBAT(min).
- Minimum switching frequency, fSW(min). This occurs at VBAT(min) and maximum load. Note, it is recommended that the lowest possible switching frequency be used, in order to minimize switching losses and to shift the differential harmonics down the frequency spectrum. This is a compromise with the sizing of the magnetics and filtering components.
- Maximum duty cycle. This should typically not exceed 0.7, in order to avoid excessive losses in the secondary output circuits.
- Efficiency of converter, η% , at V BAT(min). This will typically be between 80% and 85%.
- Resonant capacitor, C11, connected between the LX pin and ground. The resonant half period of 1 μs may be achieved with the parasitic capacitance that exists in the circuit. Fine tuning can be performed by adding additional capacitance.
- Known magnetic core set. Material selection should be based on performance at elevated temperature, and include consideration of flux density, losses, Curie temperature, and so forth.
Automotive Quasi-Resonant Flyback Control ICA4401 10Allegro MicroSystems, Inc. Worcester, Massachusetts 01615-0036 (508) 853-5000 www.allegromicro.com
- Magnetics sizing can be determined using techniques such as area product or geometric product, or by fol- lowing manufacturers guidelines, usually in the form of nomograms. To simplify the design process, the resonant switch- ing transition is ignored and the calculations are based on the switcher operating at the boundary condition of continuous/discontinuous conduction. This is a reasonable assumption as the resonant period forms a small percentage of the overall period at minimum line voltage and maximum load (where the magnetics are designed because of worst case conditions). The objective of the design is to achieve 0 V switch- ing when V BAT = 13.5 V (note that this voltage can be adjusted for any value). At VBAT voltages of less than 13.5 V , 0 V switching is still achieved. In addition, the LX voltage is prevented from swinging negative as the MOSFET, Q1, is commanded on as soon as 0 V is reached. To ensure that the reflected output voltage forces the LX node to 0 V , the following condition must be met: 13.5n = VOUT , (19) where n is the step-up turns ratio from primary to con- trolled output. Worst case conditions in terms of core saturation occur when VBAT is at a minimum and duty cycle, D, a maximum: (VBAT(min) × n ) + VOUT D(max) = VOUT . (20) The primary magnetizing inductance can be deter- mined from the following formula, which is derived by equating the input energy to the output energy times the efficiency: 2 × fSW(min) × POUT ²HLPRI = × ( VBAT(min) × D(max)) . (21) Then, maximum peak current can be found: fSW(min) × LPRI IPEAK(max) = VBAT(min) × D(max) . (22) The worst case operating flux density, BOP , can be found from the ferrite core manufacturers datasheet, by taking the saturation flux density, B SAT , at elevated temperatures and subtracting a margin, approximately 15% , to allow for operation in current limit mode or during startup. After an appropriate magnetic core set has been selected, the number of turns required on the primary winding can be found: fSW(min) × BOP × Ae NP = VBAT(min) × D(max) . (23) where Ae is the magnetics cross-sectional area in m2. The number of secondary turns can be derived through the turns ratio found previously: NS1 n × NP= . (24) If there is more than one output, the additional second- ary windings are simply scaled from the main second- ary as shown in the following formula: VOUT1 NS2 NS1× = VOUT2 , (25) where: NS2 is the quantity of turns in the additional wind- ings, VOUT1 is the output voltage from main winding, and VOUT2 is the output voltage from any additional windings. The total air gap, lg, can be found. First, an approxi- mate air gap, lg(approx), is found before flux fringing is taken into account. Given:
Automotive Quasi-Resonant Flyback Control ICA4401 11Allegro MicroSystems, Inc. Worcester, Massachusetts 01615-0036 (508) 853-5000 www.allegromicro.com then: LP Ig(approx) = μO × Ae × NP ² (27) Because of flux fringing effects, the above air gap should be modified, according to the following formu- las. Given: 2 × GF = Ig(approx) Ig(approx)A½ e × ln .⎟⎟ (28) where lg(approx) is the previously calculated approxi- mate air gap, and G is the bobbin width (the effective winding width). then the total air gap can now be found: Ig Ig(approx) × (1 + F)= . (29) Note that most ferrite core manufacturers provide a limited number of air gap sizes. It is therefore recom- mended to select a standard size. Size is indicated in terms of the Al factor, which is expressed in L/N units. The Al factor can be derived from the above two formulae. To minimize flux leakage effects, it is recommended that the air gap should be located on the center limb. If, however, a distributed air gap is used, the air gap figure should be divided by two. Some applications require an AC filament output. Typically this may be a center tapped winding with the center tap held at some bias voltage. During the MOSFET off-time, the output voltage of the control winding is simply reflected through the turns ratio of the magnetics. During the on-time of the MOSFET, the windings are driven as a forward converter because there is no rec- tifying diode to isolate this action. The voltage during this interval is simply the battery voltage transformed by the turns ratio of the filament winding and the pri- mary winding. This means that as the battery voltage varies, there will be a variation in the filament voltage. However, this variation will be less than those aris- ing in other converter topologies because, during the MOSFET off-time, the voltage is regulated. The voltage amplitude across the filament winding is: VFIL VBAT ×= NP NSF + VOUT1 × NS1 NSF , (30) where: NSF is the number of turns on the filament winding, NS1 is the number of turns on the main controlled output winding, and VOUT1 is the output voltage of the main controlled output. It is probably desirable to optimize the filament volt- age at nominal battery conditions; for example, at V BAT = 13.5 V . Due to the low voltage out, the number of integer turn combinations is limited. So, the filament voltage may not be exact. The turns range may only be 2 or 3. The magnetic wire sizing for each winding is deter- mined by the ampere-turns ratio as a proportion of the total ampere-turns of all the windings. The amount of bobbin area available for the windings is influenced by the amount of insulation required, the winding con- struction technique, and the packing density of the cir- cular wire. A conservative utilization factor is 0.5, that is, 50% of the bobbin window area filled with copper. The rms current of each winding has to be determined. The worst case condition is at minimum input voltage and maximum load. The primary winding current is identical to the current flowing in the current sense resistor (see the Current Sense Resistor Selection section). The current in each of the other output windings can be found as follows. Given: 2 × IOUT D'(max)IPK = , (31)
12Allegro MicroSystems, Inc. is the duty cycle, limited to 0.3. out, the ampere-turns factor can now be determined. wound in parallel will be necessary. where TR is a half resonant period of 1 μs. little additional capacitance. Figure 3. Main power loop
13Allegro MicroSystems, Inc. and sense resistor is as short and “tight” as possible. ground should be as short as possible. tioned close together and forming a tight loop. trates one of the output loops. any of the output power loops or ground connections. Figure 4. One of three output power loops
14Allegro MicroSystems, Inc. sions and should therefore be suppressed. almost completely damped, as shown in Figure 6. input current, thus reducing the conducted emissions. nance should occur in the region of tens of megahertz. procedure can be applied to address both issues. Figure 5. Voltages with 0 V switching of Q1 at VBAT of 7 V Figure 6. Voltages with 0 V switching of Q1 at VBAT of 13.5 V
15Allegro MicroSystems, Inc.
- Measure the voltage resonant frequency, f
- Add an additional capacitance (C11) between LX
LLEAK is the parasitic inductance.
- Now to calculate component values that will result
- With CLEAK solved, solve for LLEAK
- Finally, solve for the characteristic impedance of the
in terms of complying with radiated emissions. negligible additional power loss. the Functional Block diagram. Figure 7. Voltages with 0 V switching of Q1 with an R-C snubber
Automotive Quasi-Resonant Flyback Control ICA4401 16Allegro MicroSystems, Inc. Worcester, Massachusetts 01615-0036 (508) 853-5000 www.allegromicro.com The capacitance selection has been dealt with in the Input Capacitor Selection section. In terms of select- ing an inductance, generally the higher the inductance the better as far as noise rejection of the differen- tial conducted emissions is concerned. However, a large inductance usually means additional cost and increased size, therefore, it is advisable to select an inductance as large as possible within the constraints of board space and cost. The maximum average current that flows through the inductor is similar to the maximum average current that was worked out in the Current Sense Resistor Selection section. Both the rms and saturation current ratings of the inductor selected should be higher than the maximum average current. Care should be taken when selecting inductors for operation at elevated tem- peratures, because some manufacturers rate their parts using only self-generated heating, giving the impres- sion of operability at higher temperature conditions.
Automotive Quasi-Resonant Flyback Control ICA4401 17Allegro MicroSystems, Inc. Worcester, Massachusetts 01615-0036 (508) 853-5000 www.allegromicro.com Package L, 8-Pin Narrow SOIC For the latest version of this document, visit our website: www.allegromicro.com Copyright ©2007-2008, Allegro MicroSystems, Inc. Allegro MicroSystems, Inc. reserves the right to make, from time to time, such de par tures from the detail spec i fi ca tions as may be required to per- mit improvements in the per for mance, reliability, or manufacturability of its products. Before placing an order, the user is cautioned to verify that the information being relied upon is current. Allegro’s products are not to be used in life support devices or systems, if a failure of an Allegro product can reasonably be expected to cause the failure of that life support device or system, or to affect the safety or effectiveness of that device or system. The in for ma tion in clud ed herein is believed to be ac cu rate and reliable. How ev er, Allegro MicroSystems, Inc. assumes no re spon si bil i ty for its use; nor for any in fringe ment of patents or other rights of third parties which may result from its use. CSEATING PLANE 1.27 GAUGE PLANE SEATING PLANE A A Terminal #1 mark area B Reference land pattern layout (reference IPC7351 SOIC127P600X175-9AM); all pads a minimum of 0.20 mm from all adjacent pads; adjust as necessary to meet application process requirements and PCB layout tolerances; when mounting on a multilayer PCB, thermal vias at the exposed thermal pad land can improve thermal dissipation (reference EIA/JEDEC Standard JESD51-5) PCB Layout Reference View B
1.75 MAX
0.65 1.27 5.60 1.75 C0.20 0.25 (1.04) For Reference Only (reference JEDEC MS-012 AA) Dimensions in millimeters Dimensions exclusive of mold flash, gate burrs, and dambar protrusions Exact case and lead configuration at supplier discretion within limits shown 4.90 ±0.10 3.90 ±0.10 0.41 ±0.10 6.00 ±0.20 0.21 ±0.04 4° ±4 0.84 +0.43 –0.44 0.18 +0.08 –0.07