
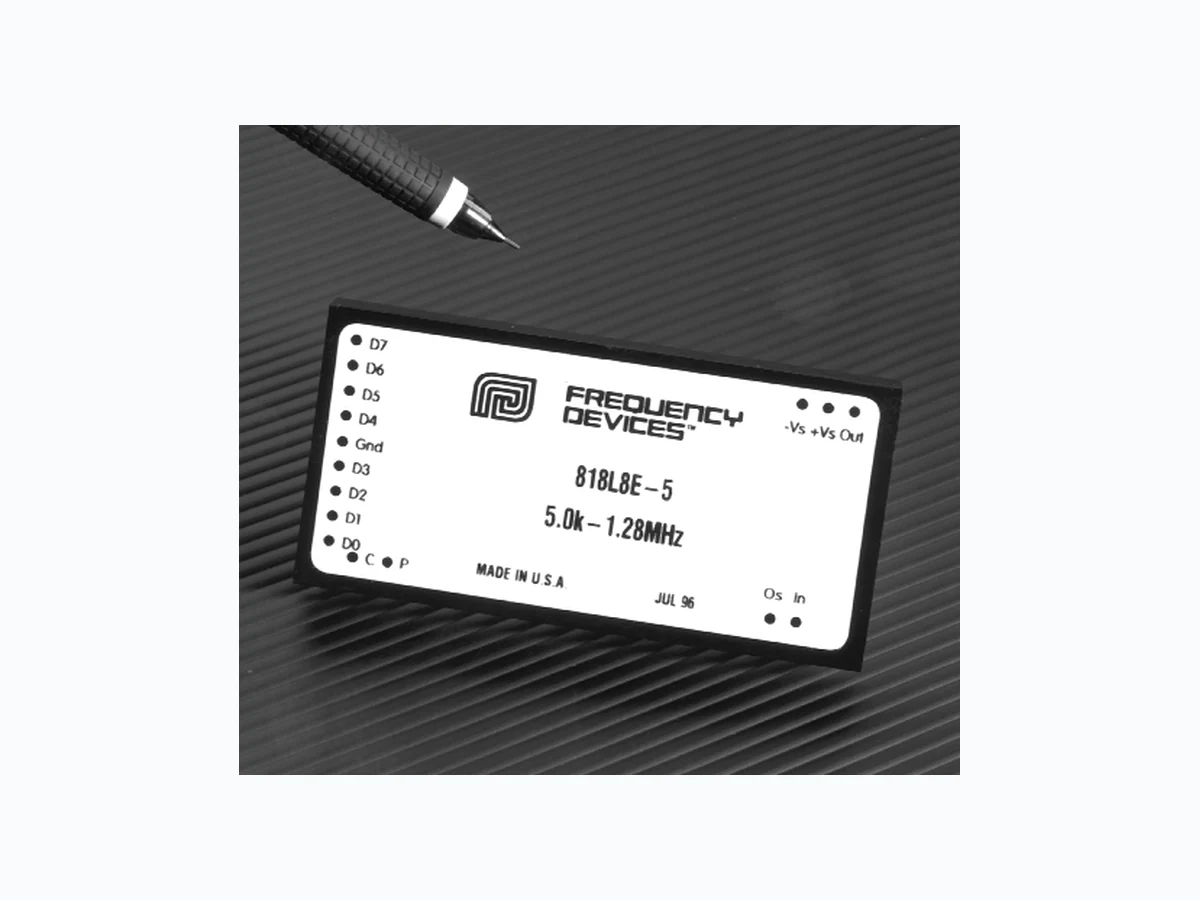
818L8B ETC1
Document overview
- Manufacturer or author: Provided By www.digicamel.com(FREE DATASHEET DOWNLOAD SITE)
- PDF pages: 13
Technical content
25 Locust St, Haverhill, Massachusetts 01830 • Tel: 800/252-7074, 978/374-0761 • FAX: 978/521-1839
e-mail: sales@freqdev.com • Web Address: http://www.freqdev.com 1 kHz to 1.28 MHz 8-Bit Programmable
818 Series
2" x 4" 8-Pole Filters
Description
The 818 Series are digitally programmable low-pass and high-pass active filters that are tunable over a 256:1 frequency range. 818 filters are available with any one of five standard factory-set tuning ranges or 8-bit custom ranges from 1 kHz to 1.28 MHz. These units contain 8 CMOS logic inputs.
818 Series models are convenient, low profile, easy
to use fully finished filters which require no external components or adjustments. They feature low harmonic distortion, and near theoretical amplitude characteristics. 818 filters operate from non-critical ±12 to ±18 Vdc power supplies, have a 5 k Ω (min.) input impedance, a 10 Ω (max.) output impedance and low-pass models offer dc voltage offset adjustment. Features/Benefits:
- Low harmonic distortion and wide signal-to-noise ratio to 12-bit resolution
- Digitally programmable corner frequency allows selecting cut-off frequencies specific to each application
- Plug-in ready-to-use, reducing engineering design and manufacturing cycle time
- Factory-set tuning range, no external clocks or adjustments needed
- Broad range of transfer characteristics and corner frequencies to meet a wide range of applications
Applications
- Anti-alias and band-pass filtering
- Data acquisition systems
- Satellite and telecommunications
- Acoustic and vibration analysis and control
- Aerospace, navigation and sonar
- Medical research and electronic equipment
- Engine test and simulation
- Noise elimination
- Video systems
- Signal reconstruction General Specifications:
8-Bit Programmable Filters Digital Tuning & Control Characteristics e-mail: sales@freqdev.com • Web Address: http://www.freqdev.com 27 26 25 24 23 22 21 20 D7 D6 D5 D4 D3 D2 D1 D0 00000000 f max/256 00000001 f max/128 00000011 f max/64 00000111 f max/32 00001111 f max/16 00011111 f max/8 00111111 f max/4 01111111 f max/2 11111111 fmax Bit Weight fc Corner Frequency +VsOUT -Vs D D D D GND D D D D CPIN Bottom ViewOs/NC Pin-Out Key IN Analog Input Signal D 7 Tuning Bit 7 (MSB) OUT Analog Output Signal D 6 Tuning Bit 6 GND Power and Signal Return D 5 Tuning Bit 5 "P" Transition Polarity Bit D 4 Tuning Bit 4 "C" Tuning Strobe Bit D 3 Tuning Bit 3 +Vs Supply Voltage, Positive D 2 Tuning Bit 2 -Vs Supply Voltage, Negative D 1 Tuning Bit 1 Os Optional Offset Adjustment D 0 Tuning Bit 0 (LSB) NC No Connect (Highpass Models) Digital Tuning Characteristics The digital tuning interface circuits are two 4042 quad CMOS latches which accept the following CMOS-compatible inputs: eight tuning bits (D 0 - D7), a latch strobe bit (C), and a transition polarity bit (P). Filter tuning follows the tuning equation given below: fc = ( fmax/256 ) [ 1 + D7 x 2 + D6 x 2 + D5 x 2 + D4 x 2 + D3 x + D2 x 2 + D1 x 2 + D0 x 2 where D1 - D7 = "0" or "1", and fmax = Maximum tuning frequency; fc = corner frequency; Minimum tunable frequency = fmax/256 (D0 thru D7 = 0); Minimum frequency step (Resolution) = fmax/256 Data Control Specifications Data Control Lines Functions Latch Strobe (C) Transition Polarity (P) Data Control Modes Mode 1 P = 0; C = 0 frequency follows input codes P = 0; C = 0⇑ frequency latched on rising edge Mode 2 P = 1; C = 1 frequency follows input codes P = 1; C = 1⇓ frequency latched on falling edge Input Data Levels (CMOS Logic) Input Voltage (Vs = 15 Vdc) Low Level In 0 Vdc min. 4 Vdc max. High Level In 11 Vdc min. 15 Vdc max. Input Current High Level In - 10 µA typ. -1 mA max. Low Level In +10 µA typ. +1 µA max. Input Capacitance 5 pF typ 7.5 pF max. Latch Response Data Set Up Time 25 nS Data Hold Time 50 nS Strobe Pulse Width 80 nS min. Input Data Format Frequency Select Bits Positive Logic Logic "1" = +Vs Logic "0" = Gnd Bit Weighting (Binary-Coded) D0 LSB (least significant bit) D7 MSB (most significant bit) Frequency Range 256 : 1, Binary Weighted Notes: 1.Frequency data must be present before occurrence of strobe edge. 2.Frequency data must be present after occurrence of strobe edge.
e-mail: sales@freqdev.com • Web Address: http://www.freqdev.com 8-Bit Programmable 1.Unit to unit match for the same transfer function, set to the same frequency and operating configuration, and from the same m anufacturing lot. Model 818L8B 818L8L 818L8E 818L8D80 Product Specifications Transfer Function 8-Pole, 8-Pole, 8-Pole, 6 zero, 8-Pole, 6 zero, Butterworth Bessel Elliptic Constant Delay Range f c 1 kHz to 128 MHz 1 kHz to 1.28 MHz 1 kHz to 1.28 MHz 1 kHz to 1.28 MHz Theoretical Transfer Appendix A Appendix A Appendix A Appendix A Characteristics Page 9 Page 4 Page 24 Page 21 Passband Ripple 0.0 dB 0.0 dB ± 0.035 dB 0.15 dB (theoretical) Stopband Attenuation Rate 48 dB/octave 48 dB/octave 80 dB min. 80 dB min. Cutoff Frequency fc ± 3% max. f c ± 3% max. f r ± 3% max. f c ± 3% max. Amplitude - 3 dB - 3 dB - 0.035 dB - 3 dB Phase Match1 See page 5 & 6 See page 5 & 6 See page 5 & 6 See page 5 & 6 Total Harmonic < - 88 dB typ. < - 88 dB typ. < - 88 dB typ. < - 88 dB typ. Distortion @ 1 kHz Wide Band Noise 300 µVrms typ. 300 µVrms typ. 350 µVrms typ. 300 µVrms typ. (5 Hz - 2 MHz) Narrow Band Noise 75 µVrms typ. 75 µVrms typ. 75 µVrms typ. 75 µVrms typ. (5 Hz - 100 kHz) Filter Mounting Assembly FMA-04A FMA-04A FMA-04A FMA-04A
e-mail: sales@freqdev.com • Web Address: http://www.freqdev.com 8-Bit Programmable 1.Unit to unit match for the same transfer function, set to the same frequency and operating configuration, and from the same m anufacturing lot. Model 818H8B 818H8E Product Specifications Transfer Function 8-Pole, 8-Pole, 6-zero, Butterworth Elliptic Range f c 1 kHz to 1.28 MHz 1 kHz to 1.28 MHz Theoretical Transfer Appendix A Appendix A Characteristics Page 29 Page 37 Passband Ripple 0.0 dB ± 0.035 dB (theoretical) Voltage Gain 0 ± 0.5 dB to 1.28 MHz 0 ± 0.5 dB to 1.28 MHz (non-inverting) Power Bandwidth (-6 dB) 5 MHz (-6 dB) 5 MHz Stopband Attenuation Rate 48 dB/octave 80 dB Cutoff Frequency fc ± 3% max. f r ± 3% max. Stability ± 0.01% /°C ± 0.01% /°C Amplitude - 3 dB - 0.035 dB Phase -360° -323.5° Filter Attenuation 80 dB 0.31 f c 80.0 dB 0.56 f r (theoretical) 60 dB 0.42 f c 60.0 dB 0.60 f r 3.01 dB 1.00 f c 3.01 dB 0.88 f r 0.00 dB 2.00 f c 0.03 dB 1.00 f r 00.0 dB 2.00 f r (theoretical) ± 0.3 dB typ. ± 0.3 dB typ. ± 0.5 dB typ. ± 0.5 dB typ. Total Harmonic < - 88 dB typ. < - 88 dB typ. Distortion @ 1 kHz Wide Band Noise 400 µVrms typ. 450 µVrms typ. Narrow Band Noise 100 µVrms typ. 100 µVrms typ. Filter Mounting Assembly FMA-04A FMA-04A
1 kHz to 1.28 MHz e-mail: sales@freqdev.com • Web Address: http://www.freqdev.com Phase Deviation from Theoretical: The phase response of the amplifiers and the capacitance of the frequency control switches of the 818 series contribute to the overall phase response and cause it to deviate from theoretical. For the higher frequency models ( -4 and -5 ), where the cutoff frequencies can be programmed up to 1.28MHz, the deviation from theoretical can be substantial. Figure 1 is a normalized plot of the phase deviation from theoretical for an 818L8E-5 for programmed cutoff frequencies from 5kHz ( fc min ) to 1.28MHz (fc max ). For fc of 5kHz, the deviation from the 323 ° theoretical phase shift is 2 ° but for fc of 1.28MHz the deviation is 78°. This set of curves can be used to estimate the deviation from theoretical phase for other models in the 818 series. Figure 1 represents a "maximum deviation from theoretical phase" situation. Other models (i.e. -1 to -4) will exhibit a similar set of phase deviation curves with the phase scale being reduced by the ratio of the f max of the model to the f max of the -5. For example, an L8E- 1, whose programming frequency range is from 1kHz to 256kHz (1/5 of the range of the -5 model) will have a similar set of phase deviation curves but the maximum phase deviation, at the highest frequency setting (fc max), will be approximately 1/5 that of the -5 model (78/5 = 15.6°). The other programmed settings of the -1 will also produce proportionally reduced phase deviations. Unit to Unit Phase Match The actual phase shift through a filter at a frequency " f " is determined by its programmed frequency " fc ", the theoretical phase response of the transfer function (B, L, E, or D80) and the phase deviation from theoretical which in turn depends upon component tolerances, the model # (i.e. -1 through -5) and frequency to which it is programmed. It is therefore not possible to have a meaningful unit to unit phase match that is specified by a single number. For a group of the same model type and number, programmed to the same frequency, the unit to unit phase match can be approximated as a percentage of the theoretical phase shift with a correction term added to accommodate amplifier induced phase deviations. EXAMPLE: Phase Match Calculation ∆Φ(f)max = 0.02° x Φτ(f) + 4.0° x f/fc x fmax/1.28MHz 4.0° - L8L 3.0° - L8B & L8D80 2.0° - L8L ∆Φ(f)typ =0.5 x ∆Φ(f)max where: ∆Φ(f) = phase match at frequency f Φτ (f) = theoretical phase shift at f f = frequency of interest f max = maximum fc of the model fc = frequency to which the filter is programmed Eg. - for an 818L8E-3, the phase deviation from theoretical at a frequency of 192kHz, when the cutoff frequency fc is programmed to 384kHz is: f/fc = 192kHz/384kHz = 0.5, fmax = 768kHz Φτ(f) = 133° (from data table at f/fc = 0.5) Phase Match: ∆Φ(f)max = 0.02° x Φτ(f) + 4.0° x f/fc x fmax/1.28MHz ∆Φ(f)typ =0.5 x ∆Φ(f)max = 0.5° x 3.86° = 1.93° 818L8E Phase Deviation (in degrees “°”) from Theoretical vs. Normalized Input Frequency programmed setting of fc f/fc 5kHz 10kHz 20kHz 40kHz 80kHz 160kHz 320kHz 640kHz 1.28MHz
e-mail: sales@freqdev.com • Web Address: http://www.freqdev.com -10 -20 -30 -40 -50 -60 -70 -80 degrees "°" f/fc 5kHz10kHz20kHz 40kHz 80kHz 160kHz 320kHz 640kHz 1.28MHz Phase Deviation from Theoretical
(25°C and Vs ± 15 Vdc)
Ordering Information
We hope the information given here will be helpful. The information is based on data and our best knowledge, and we consider the information to be true and accurate. Please read all statements, recommendations or suggestions herein in conjunction with our conditions of sale which apply to all goods supplied by us. We ass ume no responsibility for the use of these statements, recommendations or suggestions, nor do we intend them as a recommendation for any use which would infringe any patent or copyri ght. IN-00818-01 DC Offset Adjustment ± Vs - Vs 20 k Ω (Cermet) Do not connect if trim is not required. OS Analog Input Characteristics1 Impedance 5 k Ω min. Voltage Range ± 10 Vpeak Max. Safe Voltage ±Vs Analog Output Characteristics Impedance (Closed Loop) 11 Ω typ. 10 Ω max. Linear Operating Range ±10V Maximum Current2 ±5 mA Offset Voltage3 22 mV typ. 10 mV max. Offset Temp. Coeff. 50 µV/°C Power Supply (±Vs) Rated Voltage ±15 Vdc Operating Range ±12 to ±18 Vdc Maximum Safe Voltage ±18 Vdc Quiescent Current 100 mA typ. 120 mA max. Temperature Operating -20 to +70°C Storage -25 to +85 °C Notes: 1. Input and output signal voltage referenced to supply common. 2. Output is short circuit protected to common. DO NOT CONNECT TO ±Vs. 3. Adjustable to zero. 4. Units operate with or without offset pin connected. e-mail: sales@freqdev.com • Web Address: http://www.freqdev.com Side View +VsOUT -Vs D D D D GND D D D D CPIN 2.00 0.4 4.00 Bottom View 0.2 min 0.04 Dia. Os /NC Filter Mounting Assembly-See FMA-04A Pin-Out & Package Data All dimensions are in inches All Case Dimensions ± 0.02" Grid Dimensions 0.1" x 0.1" 818L8E-5 Transfer Function B - Butterworth L - Bessel E - elliptic D80 - constant delay Filter Type L - Low Pass H - High Pass Number Range (kHz) Step (kHz) 1 1kHz to 256kHz 1kHz 2 2kHz to 512kHz 2kHz 3 3kHz to 768kHz 3kHz 4 4kHz to 1,024kHz 4kHz 5 5kHz to 1,280kHz 5kHz
25 Locust St., Haverhill, Massachusetts 01830 ∑ Tel:800/252-7074, 978/374-0761 ∑ FAX:978/521-1839 e-mail: sales@freqdev.com ∑ Web Address: http://www.freqdev.com ∑ Fax on Demand: 978/521-5178 Normalized Time (1/f sec) Step Response (V/V) Step Response 0 1 2 3 4 5 -0.2 -0.0 0.2 0.4 0.6 0.8 1.0 1.2 Normalized Time (1/f sec) Delay (sec) Delay (Normalized) 0.1 1.02 3 4 5 6 7 8 90.0 0.5 1.0 1.50.15 Normalized Frequency(f/fc) Amp (dB) Frequency Response 0.1 1.0 10.02 3 4 5 6 78 2 3 4 5 6 7 -100 -80 -60 -40 -20 (sec) Theoretical Transfer Characteristics 0.00 0.10 0.20 0.30 0.40 0.50 0.60 0.70 0.80 0.85 0.90 0.95 1.00 1.10 1.20 1.30 1.40 1.50 1.60 1.70 1.80 1.90 2.00 2.25 2.50 2.75 3.00 3.25 3.50 4.00 5.00 6.00 7.00 8.00 9.00 10.0 1.Normalized Group Delay: The above delay data is norm alized to a corner frequency of 1.0H z.The actual delay is the norm alized delay divided by the actual corner frequency (fc). Actual Delay = Normalized Delay Actual Corner Frequency (fc) in Hz f/fc (Hz) Amp (dB) Phase (deg) Delay -79.2 -89.8 -99.0 -107 -114 -33.4 -38.3 -43.1 -51.8 -66.8 -12.1 -13.7 -18.1 -23.1 -28.3 -6.10 -7.08 -8.16 -9.36 -10.7 -2.71 -3.01 -3.67 -4.40 -5.20 -1.06 -1.45 -1.91 -2.16 -2.42 0.00 -0.029 -0.117 -0.264 -0.470 -0.737 -610 -626 -638 -647 -655 -489 -509 -526 -552 -587 -345 -362 -402 -436 -465 -255 -273 -291 -309 -327 -173 -182 -200 -219 -237 -109 -128 -146 -155 -164 0.00 -18.2 -36.4 -54.7 -72.9 -91.1 .052 .038 .029 .023 .018 .241 .201 .170 .126 .077 .482 .468 .417 .352 .291 .505 .504 .502 .498 .492 .506 .506 .506 .506 .506 .506 .506 .506 .506 .506 .506 .506 .506 .506 .506 .506
0.1 1.0 10.02 3 4 5 6 78 2 3 4 5 6 7 Normalized Frequency(f/fc) -100 -80 -60 -40 -20 Amp (dB) 0.1 1.02 3 4 5 6 7 8 9 Normalized Time (1/f sec) 0.0 1.0 2.0 Delay (sec) 1.50.15 0 1 2 3 4 5 Normalized Time (1/f sec) -0.0 0.2 0.4 0.6 0.8 1.0 1.2 Step Response (V/V) Frequency Response Delay (Normalized) Step Response (sec) Theoretical Transfer Characteristics 0.00 0.10 0.20 0.30 0.40 0.50 0.60 0.70 0.80 0.85 0.90 0.95 1.00 1.10 1.20 1.30 1.40 1.50 1.60 1.70 1.80 1.90 2.00 2.25 2.50 2.75 3.00 3.25 3.50 4.00 5.00 6.00 7.00 8.00 9.00 10.0 1.Normalized Group Delay: The above delay data is norm alized to a corner frequency of 1.0H z.The actual delay is the norm alized delay divided by the actual corner frequency (fc). Actual Delay = Normalized Delay Actual Corner Frequency (fc) in Hz f/fc (Hz) Amp (dB) Phase (deg) Delay -125 -135 -144 -153 -160 -76.3 -81.9 -87.1 -96.3 -112 -44.6 -48.2 -56.3 -63.7 -70.3 -23.4 -28.2 -32.7 -36.9 -40.8 -1.58 -3.01 -7.48 -12.9 -18.2 -671 -678 -683 -687 -691 -621 -629 -635 -646 -661 -560 -568 -586 -600 -611 -494 -511 -526 -539 -550 -0.001 -0.014 -0.121 -0.311 -0.738 0.00 0.00 0.00 0.00 0.00 0.00 -333 -360 -408 -445 -472 -185 -221 -261 -283 -307 0.00 -29.4 -59.0 -89.1 -120 -152 .023 .017 .013 .010 .008 .094 .080 .069 .052 .033 .253 .226 .174 .139 .113 .540 .448 .380 .328 .287 1.48 1.46 1.17 .873 .672 .956 1.04 1.19 1.29 1.40 .816 .819 .828 .843 .867 .903 25 Locust St., Haverhill, Massachusetts 01830 ∑ Tel :800/252-7074, 978/374-0761 ∑ FAX:978/521-1839 e-mail: sales@freqdev.com ∑ W eb Address: http://www.freqdev.com ∑ Fax on Demand: 978/521-5178
8-Pole, 6-Zero Constant Delay Appendix A Low-Pass (80 dB) 25 Locust St., Haverhill, Massachusetts 01830 ∑ Tel :800/252-7074, 978/374-0761 ∑ FAX:978/521-1839 e-mail: sales@freqdev.com ∑ W eb Address: http://www.freqdev.com ∑ Fax on Demand: 978/521-5178 Normalized Frequency(f/fc) Amp (dB) Normalized Time (1/f sec) Delay (sec) Normalized Time (1/f sec) Step Response (V/V) Frequency Response Delay (Normalized) Step Response 0.1 1.0 10.02 3 4 5 6 78 2 3 4 5 6 7 -100 -80 -60 -40 -20 0.1 1.02 3 4 5 6 7 8 90.0 0.5 1.0 1.50.15 0 1 2 3 4 5 -0.2 -0.0 0.2 0.4 0.6 0.8 1.0 1.2 1.Normalized Group Delay: The above delay data is norm alized to a corner frequency of 1.0H z.The actual delay is the norm alized delay divided by the actual corner frequency (fc). Actual Delay = Normalized Delay Actual Corner Frequency (fc) in Hz 1.40 1.60 1.80 2.00 2.25 0.90 0.95 1.00 1.10 1.20 0.50 0.60 0.70 0.80 0.85 0.00 0.10 0.20 0.30 0.40 (sec) Theoretical Transfer Characteristics 1f/fc (Hz) Amp (dB) Phase (deg) Delay 6.50 7.00 8.00 9.00 10.0 5.00 5.25 5.50 5.75 6.00 3.75 4.00 4.25 4.50 4.75 2.50 2.75 3.00 3.25 3.50 -86.6 -85.1 -84.1 -84.3 -84.9 -92.8 -104 -101 -93.3 -89.9 -98.3 -86.3 -84.1 -85.1 -87.9 -43.4 -50.3 -57.6 -62.5 -75.4 -11.3 -17.1 -23.2 -29.1 -36.3 -1.89 -2.41 -3.01 -4.50 -6.39 0.034 -0.157 -0.510 -1.07 -1.44 0.00 0.017 0.058 0.099 0.105 -300 -305 -312 -317 -321 -462 -466 -289 -293 -295 -616 -442 -448 -454 -458 -561 -576 -589 -599 -608 -417 -459 -492 -517 -542 -276 -291 -306 -336 -365 -153 -184 -215 -245 -261 0.00 -30.7 -61.3 -92.0 -123 .026 .022 .017 .013 .011 .044 .040 .036 .033 .030 .079 .069 .061 .054 .049 .189 .153 .127 .107 .092 .656 .512 .396 .312 .239 .849 .846 .841 .821 .783 .852 .852 .852 .851 .850 .852 .852 .852 .852 .852
8-Pole, 6-Zero Elliptic, 1.77 Appendix A Low-Pass 25 Locust St., Haverhill, Massachusetts 01830 ∑ Tel :800/252-7074, 978/374-0761 ∑ FAX:978/521-1839 e-mail: sales@freqdev.com ∑ W eb Address: http://www.freqdev.com ∑ Fax on Demand: 978/521-5178 Normalized Frequency(f/fc) Amp (dB) Normalized Time (1/f sec) Delay (sec) Normalized Time (1/f sec) Step Response (V/V) Frequency Response Delay (Normalized) Step Response 0.1 1.02 3 4 5 6 7 8 90.0 2.0 4.0 1.50.15 0.8 0.1 1.0 10.02 3 4 5 6 78 2 3 4 5 6 7 -100 -80 -60 -40 -20 0 1 2 3 4 5 -0.0 0.2 0.4 0.6 0.8 1.0 1.2 1.Normalized Group Delay: The above delay data is norm alized to a corner frequency of 1.0H z.The actual delay is the norm alized delay divided by the actual corner frequency (fc). Actual Delay = Normalized Delay Actual Corner Frequency (fc) in Hz (sec) Theoretical Transfer Characteristics 1f/fc (Hz) Amp (dB) Phase (deg) Delay 4.00 5.00 6.00 7.00 2.40 2.60 2.80 3.00 3.50 1.85 1.90 1.95 2.00 2.20 1.50 1.60 1.70 1.75 1.80 1.00 1.10 1.20 1.30 1.40 0.75 0.80 0.85 0.90 0.95 0.50 0.55 0.60 0.65 0.70 8.00 9.00 10.0 0.00 0.10 0.20 0.30 0.40 -86.2 -87.8 -89.3 -83.1 -82.1 -83.1 -84.6 -82.0 -83.5 -88.2 -99.9 -87.2 -83.6 -82.0 -83.7 -87.8 -85.8 -40.1 -51.5 -65.2 -75.0 -113.0 -0.035 -1.76 -8.28 -18.4 -29.3 -0.015 -0.041 -0.046 -0.016 -0.025 0.007 0.022 0.033 0.031 0.014 0.00 -0.004 -0.014 -0.024 -0.020 -160 -163 -164 -140 -148 -154 -157 -289 -295 -301 -305 -134 -440 -444 -447 -450 -280 -578 -594 -606 -611 -616 -323 -392 -467 -522 -558 -213 -232 -251 -272 -296 -133 -148 -163 -179 -196 0.00 -25.7 -51.6 -77.9 -105 0.007 0.005 0.004 0.030 0.018 0.013 0.009 0.099 0.081 0.067 0.057 0.040 0.217 0.198 0.182 0.168 0.126 0.517 0.381 0.296 0.265 0.239 1.65 2.14 1.86 1.19 0.753 0.989 1.04 1.12 1.23 1.40 0.811 0.840 0.872 0.908 0.946 0.713 0.716 0.724 0.740 0.767
0.1 1.0 10.02 3 4 5 6 78 2 3 4 5 6 7 Normalized Frequency(f/fc) -100 -80 -60 -40 -20 Amp (dB) Frequency Response (sec) Theoretical Transfer Characteristics 0.10 0.20 0.30 0.40 0.50 0.60 0.70 0.80 0.85 0.90 0.95 1.00 1.20 1.40 1.60 1.80 2.00 2.50 3.00 4.00 5.00 6.00 7.00 8.00 9.00 10.0 1.Normalized Group Delay: The above delay data is norm alized to a corner frequency of 1.0H z.The actual delay is the norm alized delay divided by the actual corner frequency (fc). Actual Delay = Normalized Delay Actual Corner Frequency (fc) in Hz f/fc (Hz) Amp (dB) Phase (deg) Delay 0.00 0.00 0.00 0.00 0.00 0.00 0.00 0.00 0.00 0.00 0.00 -5.15 -3.01 -0.229 -0.020 -0.002 59.0 49.0 42.1 36.8 32.7 29.4 -35.5 -24.8 -15.6 -11.6 -8.06 -160 -112 -83.7 -63.7 -48.2 386 360 275 226 194 170 152 120 99.2 74.0 535 499 459 437 413 691 661 631 600 568 0.033 0.023 0.017 0.013 0.010 0.008 0.287 0.226 0.139 0.094 0.052 1.48 1.46 0.873 0.540 0.380 .956 1.04 1.19 1.29 1.40 0.819 0.828 0.843 0.867 0.903 25 Locust St., Haverhill, Massachusetts 01830 ∑ Tel :800/252-7074, 978/374-0761 ∑ FAX:978/521-1839 e-mail: sales@freqdev.com ∑ W eb Address: http://www.freqdev.com ∑ Fax on Demand: 978/521-5178
8-Pole, 6-Zero Elliptic, 1.77 Appendix A High-Pass 25 Locust St., Haverhill, Massachusetts 01830 ∑ Tel :800/252-7074, 978/374-0761 ∑ FAX:978/521-1839 e-mail: sales@freqdev.com ∑ W eb Address: http://www.freqdev.com ∑ Fax on Demand: 978/521-5178 Normalized Frequency(f/fc) Amp (dB) Frequency Response 0.1 1.0 10.02 3 4 5 6 78 2 3 4 5 6 7 -100 -80 -60 -40 -20 1.Normalized Group Delay: The above delay data is norm alized to a corner frequency of 1.0H z.The actual delay is the norm alized delay divided by the actual corner frequency (fc). Actual Delay = Normalized Delay Actual Corner Frequency (fc) in Hz (sec) Theoretical Transfer Characteristics 1f/fc (Hz) Amp (dB) Phase (deg) Delay 9.00 10.0 4.00 5.00 6.00 7.00 8.00 1.80 1.90 2.00 2.50 3.00 1.30 1.40 1.50 1.60 1.70 0.90 0.95 1.00 1.10 1.20 0.55 0.60 0.70 0.80 0.85 0.10 0.20 0.30 0.40 0.50 -0.01 0.00 -0.02 -0.01 -0.01 -0.01 -0.01 0.02 0.01 0.01 -0.02 -0.02 -0.03 0.01 0.03 0.03 0.03 -2.21 -0.51 -0.03 -0.01 -0.05 -90.0 -60.2 -32.4 -13.1 -6.28 -89.3 -82.1 -90.6 -82.4 -87.8 28.6 25.7 64.7 51.6 42.9 36.8 32.1 150 141 133 105 86.9 221 201 185 172 160 401 358 324 277 225 437 603 563 498 451 164 148 131 292 450 0.009 0.007 0.046 0.029 0.020 0.015 0.011 0.260 0.229 0.203 0.123 0.083 0.596 0.486 0.409 0.347 0.299 2.66 2.15 1.64 1.04 0.757 0.761 0.890 1.37 2.35 2.77 0.440 0.459 0.495 0.559 0.671