


 Download PDF
74HCT9046A NXP
Document overview
- PDF pages: 43
Technical content
Page 1
1. General description
The 74HCT9046A is a high-speed Si-gate CMOS device. It is specified in compliance with JEDEC standard no 7A.
2. Features
I Operation power supply voltage range from 4.5 V to 5.5 V I Low power consumption I Inhibit control for ON/OFF keying and for low standby power consumption I center frequency up to 17 MHz (typical) at VCC = 5.5 V I Choice of two phase comparators: N PC1: EXCLUSIVE-OR N PC2: Edge-triggered JK flip-flop I No dead zone of PC2 I Charge pump output on PC2, whose current is set by an external resistor Rbias I center frequency tolerance ±10 % I Excellent Voltage Controlled Oscillator (VCO) linearity I Low frequency drift with supply voltage and temperature variations I On-chip band gap reference I Glitch free operation of VCO, even at very low frequencies I Zero voltage offset due to operational amplifier buffering
I ESD protection: N HBM JESD22-A114F exceeds 2000 V N MM JESD22-A115-A exceeds 200 V

Page 2
3. Applications
I FM modulation and demodulation where a small center frequency tolerance is essential I Frequency synthesis and multiplication where a low jitter is required (e.g. video picture-in-picture) I Frequency discrimination I Tone decoding I Data synchronization and conditioning I Voltage-to-frequency conversion I Motor-speed control
4. Ordering information
Table 1. Ordering information
| Type number | Package | |||
|---|---|---|---|---|
| Temperature range | Name | Description | Version | |
74HCT9046AN
−40 °C to +125 °C DIP16
plastic dual in-line package; 16 leads (300 mil)
SOT38-4
74HCT9046AD
−40 °C to +125 °C SO16
plastic small outline package; 16 leads; body width
SOT109-1
3.9 mm
74HCT9046APW −40 °C to +125 °C TSSOP16 plastic thin shrink small outline package; 16 leads;
SOT403-1
body width 4.4 mm
2 of 43
Page 3
5. Block diagram
6. Functional diagram
3 of 43
Page 4
4 of 43
Page 5
7. Pinning information
7.1 Pinning
7.2 Pin description
Table 2. Pin description Symbol
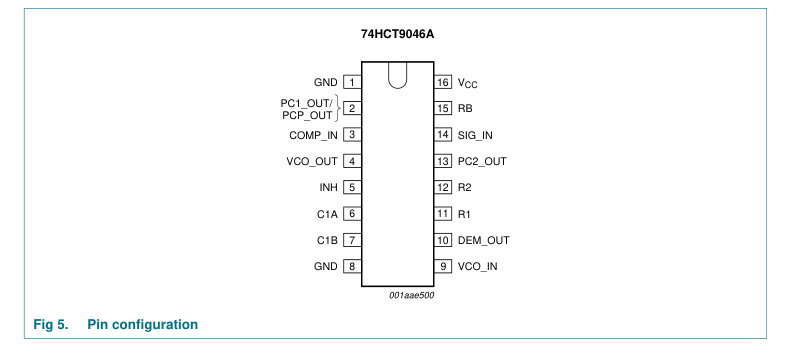
Pin
Description
ground (0 V) of phase comparators
GND
1
phase comparator 1 output or phase comparator pulse output
PC1_OUT/PCP_OUT
2
COMP_IN
3
comparator input
VCO_OUT
4
VCO output
INH
5
inhibit input capacitor C1 connection A
C1A
6
capacitor C1 connection B
C1B
7
GND
8
ground (0 V) VCO
VCO_IN
9
VCO input
DEM_OUT
10
demodulator output
R1
11
resistor R1 connection
R2
12
resistor R2 connection phase comparator 2 output; current source adjustable with Rbias
PC2_OUT
13
SIG_IN
14
signal input bias resistor (Rbias) connection
RB
15 16
supply voltage
VCC
5 of 43
Page 6
8. Functional description
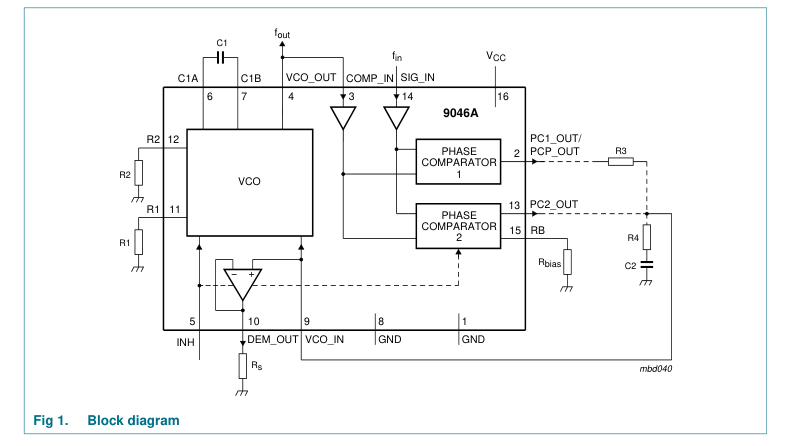
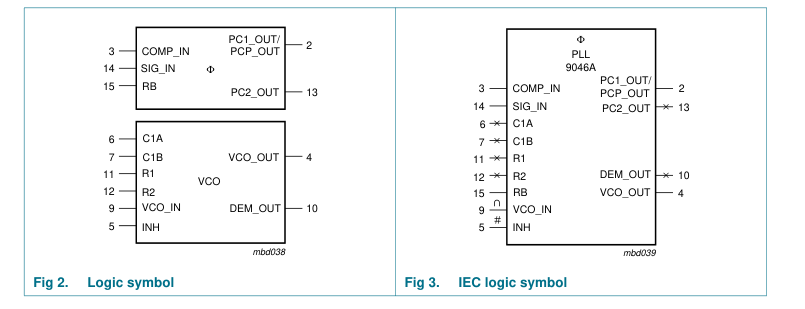
The 74HCT9046A is a phase-locked-loop circuit that comprises a linear VCO and two different phase comparators (PC1 and PC2) with a common signal input amplifier and a common comparator input, see Figure 1. The signal input can be directly coupled to large voltage signals (CMOS level), or indirectly coupled (with a series capacitor) to small voltage signals. A self-bias input circuit keeps small voltage signals within the linear region of the input amplifiers. With a passive low-pass filter, the 74HCT9046A forms a second-order loop PLL.
The principle of this phase-locked-loop is based on the familiar 74HCT4046A. However extra features are built-in, allowing very high-performance phase-locked-loop applications. This is done, at the expense of PC3, which is skipped in this 74HCT9046A. The PC2 is equipped with a current source output stage here. Further a band gap is applied for all internal references, allowing a small center frequency tolerance. The details are summed up in Section 8.1. If one is familiar with the 74HCT4046A already, it will do to read this section only.
8.1 Differences with respect to the familiar 74HCT4046A
- A center frequency tolerance of maximum ±10 %.
- The on board band gap sets the internal references resulting in a minimal frequency shift at supply voltage variations and temperature variations.
- The value of the frequency offset is determined by an internal reference voltage of 2.5 V instead of VCC − 0.7 V; In this way the offset frequency will not shift over the supply voltage range.
- A current switch charge pump output on pin PC2_OUT allows a virtually ideal performance of PC2; The gain of PC2 is independent of the voltage across the low-pass filter; Further a passive low-pass filter in the loop achieves an active performance. The influence of the parasitic capacitance of the PC2 output plays no role here, resulting in a true correspondence of the output correction pulse and the phase difference even up to phase differences as small as a few nanoseconds.
- Because of its linear performance without dead zone, higher impedance values for the filter, hence lower C-values, can be chosen; correct operation will not be influenced by parasitic capacitances as in case of the voltage source output using the 74HCT4046A.
- No PC3 on pin RB but instead a resistor connected to GND, which sets the load/unload currents of the charge pump (PC2).
- Extra GND pin 1 to allow an excellent FM demodulator performance even at 10 MHz and higher.
- Combined function of pin PC1_OUT/PCP_OUT. If pin RB is connected to VCC (no bias resistor Rbias) pin PC1_OUT/PCP_OUT has its familiar function viz. output of PC1. If at pin RB a resistor (Rbias) is connected to GND it is assumed that PC2 has been chosen as phase comparator. Connection of Rbias is sensed by internal circuitry and this changes the function of pin PC1_OUT/PCP_OUT into a lock detect output (PCP_OUT) with the same characteristics as PCP_OUT of pin 1 of the 74HCT4046A.
6 of 43
Page 7
- The inhibit function differs. For the 74HCT4046A a HIGH-level at the inhibit input (pin INH) disables the VCO and demodulator, while a LOW-level turns both on. For the 74HCT9046A a HIGH-level on the inhibit input disables the whole circuit to minimize standby power consumption.
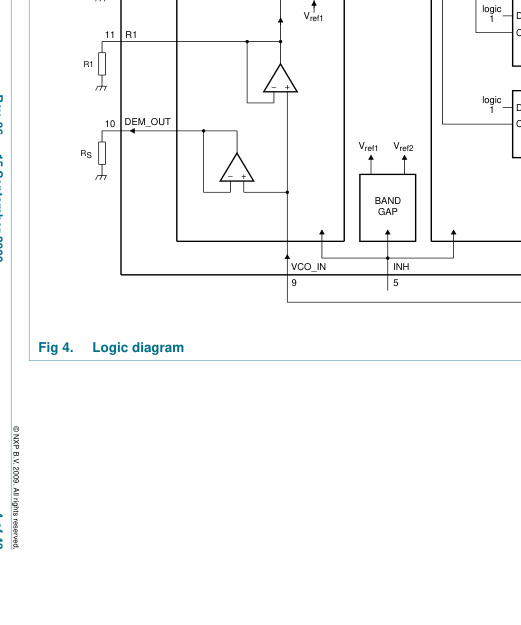
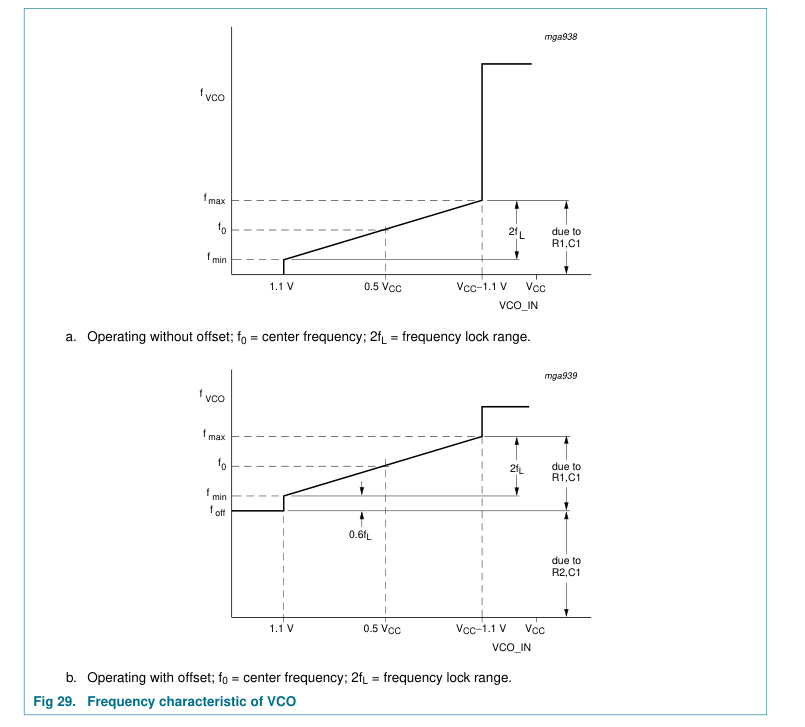
8.2 VCO The VCO requires one external capacitor C1 (between pins C1A and C1B) and one external resistor R1 (between pins R1 and GND) or two external resistors R1 and R2 (between pins R1 and GND, and R2 and GND). Resistor R1 and capacitor C1 determine the frequency range of the VCO. Resistor R2 enables the VCO to have a frequency offset if required (see Figure 4).
The high input impedance of the VCO simplifies the design of the low-pass filters by giving the designer a wide choice of resistor/capacitor ranges. In order not to load the low-pass filter, a demodulator output of the VCO input voltage is provided at pin DEM_OUT. The DEM_OUT voltage equals that of the VCO input. If DEM_OUT is used, a series resistor (Rs) should be connected from pin DEM_OUT to GND; if unused, DEM_OUT should be left open. The VCO output (pin VCO_OUT) can be connected directly to the comparator input (pin COMP_IN), or connected via a frequency divider. The output signal has a duty cycle of 50 % (maximum expected deviation 1 %), if the VCO input is held at a constant
DC level. A LOW-level at the inhibit input (pin INH) enables the VCO and demodulator, while a HIGH-level turns both off to minimize standby power consumption.
8.3 Phase comparators
The signal input (pin SIG_IN) can be directly coupled to the self-biasing amplifier at pin SIG_IN, provided that the signal swing is between the standard HC family input logic levels. Capacitive coupling is required for signals with smaller swings.
8.3.1 Phase Comparator 1 (PC1) This circuit is an EXCLUSIVE-OR network. The signal and comparator input frequencies (fi) must have a 50 % duty cycle to obtain the maximum locking range. The transfer characteristic of PC1, assuming ripple (fr = 2fi) is suppressed, is:
V CC
V DEM_OUT ---------- ΦSIG_IN ΦCOMP_IN
=
– (
)
π
where:
VDEM_OUT is the demodulator output at pin DEM_OUT VDEM_OUT = VPC1_OUT (via low-pass)
V CC
The phase comparator gain is:
= ---------- V r ( ⁄ ) K p π
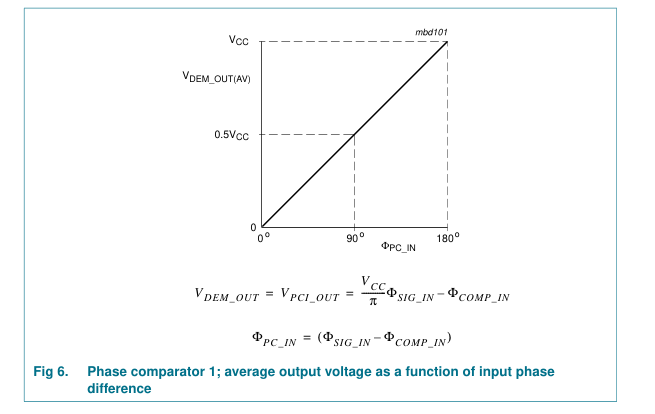
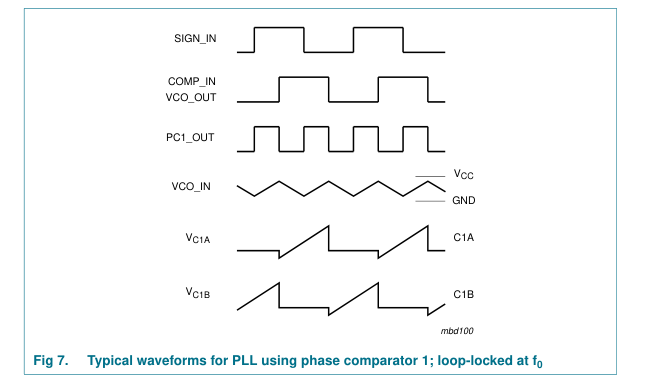
The average output voltage from PC1, fed to the VCO input via the low-pass filter and seen at the demodulator output at pin DEM_OUT (VDEM_OUT), is the resultant of the phase differences of signals (SIG_IN) and the comparator input (COMP_IN) as shown in Figure 6. The average of VDEM_OUT is equal to 0.5VCC when there is no signal or noise at SIG_IN and with this input the VCO oscillates at the center frequency (f0). Typical
7 of 43
Page 8
waveforms for the PC1 loop locked at f0 are shown in Figure 7. This figure also shows the actual waveforms across the VCO capacitor at pins C1A and C1B (VC1A and VC1B) to show the relation between these ramps and the VCO_OUT voltage.
The frequency capture range (2f0) is defined as the frequency range of input signals on which the PLL will lock if it was initially out-of-lock. The frequency lock range (2fL) is defined as the frequency range of the input signals on which the loop will stay locked if it was initially in lock. The capture range is smaller or equal to the lock range.
With PC1, the capture range depends on the low-pass filter characteristics and can be made as large as the lock range. This configuration remains locked even with very noisy input signals. Typical behavior of this type of phase comparator is that it may lock to input frequencies close to the harmonics of the VCO center frequency.
8 of 43
Page 9
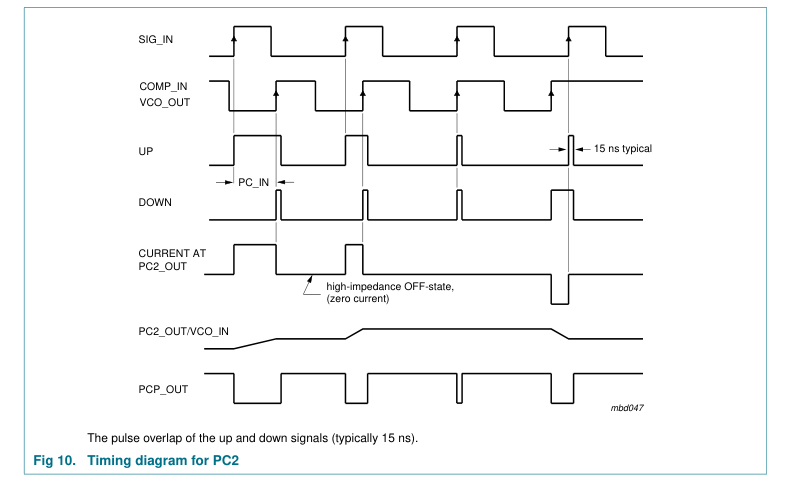
8.3.2 Phase Comparator 2 (PC2) This is a positive edge-triggered phase and frequency detector. When the PLL is using this comparator, the loop is controlled by positive signal transitions and the duty cycles of SIG_IN and COMP_IN are not important. PC2 comprises two D-type flip-flops, control gating and a 3-state output stage with sink and source transistors acting as current sources, henceforth called charge pump output of PC2. The circuit functions as an up-down counter (see Figure 4) where SIG_IN causes an up-count and COMP_IN a down count. The current switch charge pump output allows a virtually ideal performance of PC2, due to appliance of some pulse overlap of the up and down signals, see Figure 8a.
The pump current Icp is independent from the supply voltage and is set by the internal band gap reference of 2.5 V.
2.5 = 17 × ------------ A
( )
Icp Rbias
Where Rbias is the external bias resistor between pin RB and ground.
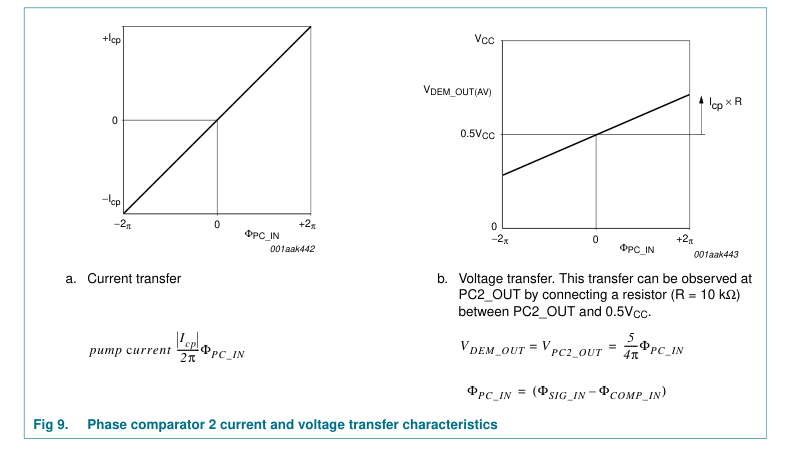
The current and voltage transfer function of PC2 are shown in Figure 9.
The phase comparator gain is:
Icp = ---------- A r ( ⁄ ) KP 2π
9 of 43
Page 10
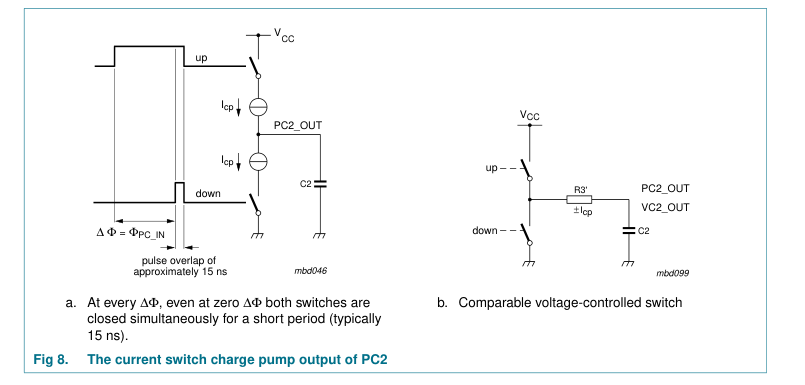
When the frequencies of SIG_IN and COMP_IN are equal but the phase of SIG_IN leads that of COMP_IN, the up output driver at PC2_OUT is held ‘ON’ for a time corresponding to the phase difference (ΦPC_IN). When the phase of SIG_IN lags that of COMP_IN, the down or sink driver is held ‘ON’.
10 of 43
Page 11
When the frequency of SIG_IN is higher than that of COMP_IN, the source output driver is held ‘ON’ for most of the input signal cycle time and for the remainder of the cycle time both drivers are ‘OFF’ (3-state). If the SIG_IN frequency is lower than the COMP_IN frequency, then it is the sink driver that is held ‘ON’ for most of the cycle. Subsequently the voltage at the capacitor (C2) of the low-pass filter connected to PC2_OUT varies until the signal and comparator inputs are equal in both phase and frequency. At this stable point the voltage on C2 remains constant as the PC2 output is in 3-state and the VCO input at pin 9 is a high-impedance. Also in this condition the signal at the phase comparator pulse
output (PCP_OUT) has a minimum output pulse width equal to the overlap time, so can be used for indicating a locked condition.
Thus for PC2 no phase difference exists between SIG_IN and COMP_IN over the full frequency range of the VCO. Moreover, the power dissipation due to the low-pass filter is reduced because both output drivers are OFF for most of the signal input cycle. It should be noted that the PLL lock range for this type of phase comparator is equal to the capture range and is independent of the low-pass filter. With no signal present at SIG_IN the VCO adjust, via PC2, to its lowest frequency.
By using current sources as charge pump output on PC2, the dead zone or backlash time could be reduced to zero. Also, the pulse widening due to the parasitic output capacitance plays no role here. This enables a linear transfer function, even in the vicinity of the zero crossing. The differences between a voltage switch charge pump and a current switch charge pump are shown in Figure 11.
11 of 43
Page 12
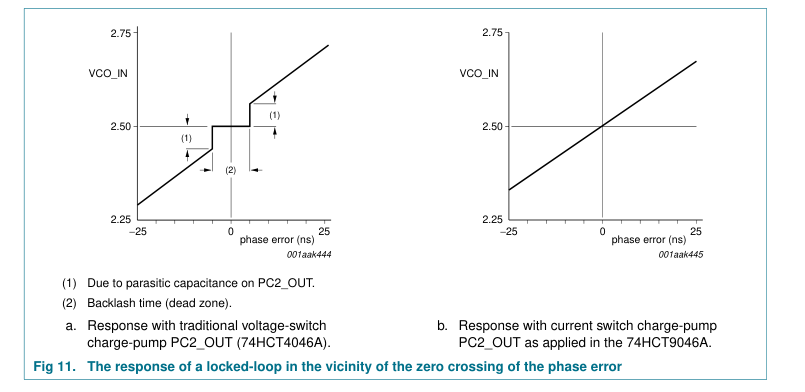
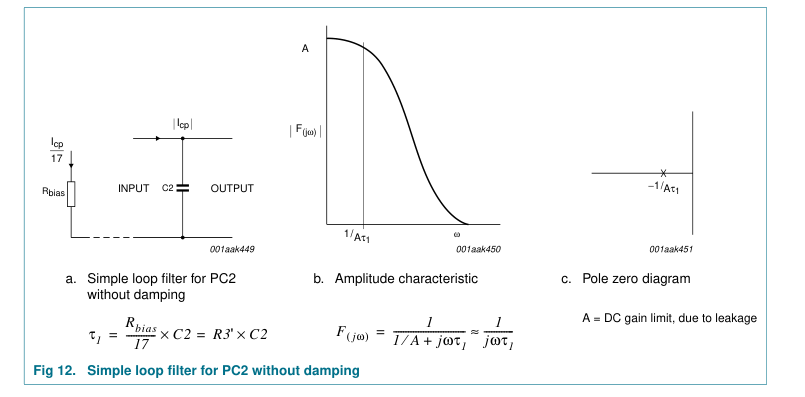
The design of the low-pass filter is somewhat different when using current sources. The external resistor R3 is no longer present when using PC2 as phase comparator. The current source is set by Rbias. A simple capacitor behaves as an ideal integrator now, because the capacitor is charged by a constant current. The transfer function of the voltage switch charge pump may be used. In fact it is even more valid, because the transfer function is no longer restricted for small changes only. Further the current is independent from both the supply voltage and the voltage across the filter. For one that is familiar with the low-pass filter design of the 74HCT4046A a relation may show how Rbias
relates with a fictive series resistance, called R3'.
This relation can be derived by assuming first that a voltage controlled switch PC2 of the 74HCT4046A is connected to the filter capacitance C2 via this fictive R3' (see Figure 8b). Then during the PC2 output pulse the charge current equals:
– V CC V C2 0 ( )
= --------------------------------- Icp
R3'
2.5
With the initial voltage VC2(0) at: 0.5VCC = 2.5 V, Icp
= ------- R3'
As shown before the charge current of the current switch of the 74HCT9046A is:
2.5 = × ------------ Icp 17 Rbias
Hence:
Rbias R3‘ = ------------ Ω
( ) 17
12 of 43
Page 13
Using this equivalent resistance R3' for the filter design the voltage can now be expressed as a transfer function of PC2; assuming ripple (fr = fi) is suppressed, as:
5 = ------ V r ( ⁄ ) KPC2 4π
Again this illustrates the supply voltage independent behavior of PC2.
8.4 Loop filter component selection
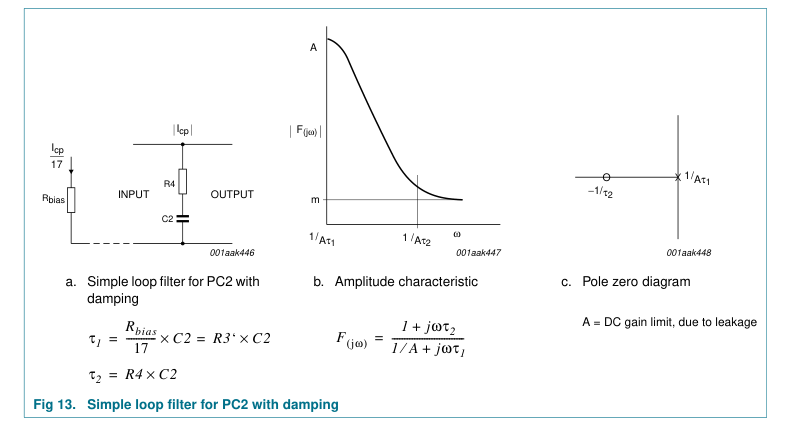
Examples of PC2 combined with a passive filter are shown in Figure 12 and 13. Figure 12 shows that PC2 with only a C2 filter behaves as a high-gain filter. For stability the damped version of Figure 13 with series resistance R4 is preferred.
Practical design values for Rbias are between 25 kΩ and 250 kΩ with R3' = 1.5 kΩ to 15 kΩ for the filter design. Higher values for R3' require lower values for the filter capacitance which is very advantageous at low values of the loop natural frequency ωn.
13 of 43
Page 14
9. Limiting values
Table 3. Limiting values In accordance with the Absolute Maximum Rating System (IEC 60134). Voltages are referenced to GND (ground = 0 V). Symbol
Parameter
Conditions
Min Max Unit
supply voltage
−0.5 +7 V
VCC
input clamping current
VI < −0.5 V or VI > VCC + 0.5 V
- ±20 mA
IIK
output clamping current
VO < −0.5 V or VO > VCC + 0.5 V
- ±20 mA
IOK
output current
−0.5 V < VO < VCC + 0.5 V
- ±25 mA
IO
supply current
- +50 mA
ICC
ground current
−50 - mA
IGND
storage temperature
−65 +150 °C
Tstg
total power dissipation
Tamb = −40 °C to +125 °C
Ptot
[1] -
750 mW
DIP16
[2] -
500 mW
SO16 and TSSOP16
[1] For DIP16 packages: above 70 °C the value of Ptot derates linearly with 12 mW/K. [2] For SO16 and TSSOP16 packages: above 70 °C the value of Ptot derates linearly with 8 mW/K.
14 of 43
Page 15
10. Recommended operating conditions
Table 4. Operating conditions Symbol
Parameter
Conditions
Min Typ Max Unit
supply voltage
4.5 5.0 5.5 V
VCC
input voltage
0 - VCC V
VI
output voltage
0 - VCC V
VO
ambient temperature
−40
+125 °C
Tamb
pin INH; VCC = 4.5 V
- 1.67 139 ns/V
∆t/∆V
input transition rise and fall rate
11. Static characteristics
Table 5. Static characteristics At recommended operating conditions; voltages are referenced to GND (ground = 0 V). Symbol
Parameter
Conditions
Min Typ Max Unit
Tamb = 25 °C Phase comparator section
3.15 2.4 -
V
HIGH-level input voltage
pins SIG_IN and COMP_IN;
VIH
VCC = 4.5 V; DC coupled
VIL
- 2.1 1.35 V
LOW-level input voltage
pins SIG_IN and COMP_IN; VCC = 4.5 V; DC coupled pins PCP_OUT and PCn_OUT;
VOH
HIGH-level output voltage
VCC = 4.5 V; VI = VIH or VIL IO = −20 µA
4.4 4.5 -
V
IO = −4.0 mA
3.98 4.32 -
V
pins PCP_OUT and PCn_OUT;
LOW-level output voltage
VOL
VCC = 4.5 V; VI = VIH or VIL IO = 20 µA
- 0 0.1 V
IO = 4.0 mA
- 0.15 0.26 V - - ±30 µA
input leakage current
pins SIG_IN and COMP_IN;
II
VCC = 5.5 V; VI = VCC or GND
IOZ
OFF-state output current
pin PC2_OUT; VCC = 5.5 V;
- - ±0.5 µA
VI = VIH or VIL; VO = VCC or GND
input resistance
SIG_IN and COMP_IN;
- 250 -
kΩ
RI
VCC = 4.5 V; VI at self-bias operating point; ∆VI = 0.5 V; see Figure 14, 15 and 16
bias resistance
VCC = 4.5 V
25 - 250 kΩ
Rbias
charge pump current
VCC = 4.5 V; Rbias = 40 kΩ
±0.53 ±1.06 ±2.12 mA
Icp VCO section
HIGH-level input voltage
pin INH; VCC = 4.5 V to 5.5 V;
2.0 1.6 -
V
VIH
DC coupled
LOW-level input voltage
pin INH; VCC = 4.5 V to 5.5 V;
- 1.2 0.8 V
VIL
DC coupled
15 of 43
Page 16
Table 5. Static characteristics …continued At recommended operating conditions; voltages are referenced to GND (ground = 0 V). Symbol
Parameter
Conditions
Min Typ Max Unit
VOH
HIGH-level output voltage
pin VCO_OUT; VCC = 4.5 V; VI = VIH or VIL IO = −20 µA
4.4 4.5 -
V
IO = −4.0 mA
3.98 4.32 -
V
LOW-level output voltage
pin VCO_OUT; VCC = 4.5 V;
VOL
VI = VIH or VIL IO = 20 µA
- 0 0.1 V
IO = 4.0 mA
- 0.15 0.26 V
pins C1A and C1B; VCC = 4.5 V;
- - 0.40 V
VI = VIH or VIL; IO = 4.0 mA
input leakage current
pins INH and VCO_IN;
- - ±0.1 µA
II
VCC = 5.5 V; VI = VCC or GND VCC = 4.5 V
3 - 300 kΩ
R1
resistor 1
VCC = 4.5 V
3 - 300 kΩ
R2
resistor 2
VCC = 4.5 V
40 - no pF
C1
capacitor 1
limit
voltage on pin VCO_IN
over the range specified for R1
VVCO_IN
VCC = 4.5 V
1.1 -
3.4 V
VCC = 5.0 V
1.1 -
3.9 V
VCC = 5.5 V
1.1 -
4.4 V
Demodulator section
series resistance
VCC = 4.5 V; at Rs > 300 kΩ the
50 - 300 kΩ
Rs
leakage current can influence VDEM_OUT
Voffset
offset voltage
VCO_IN to VDEM_OUT; VCC = 4.5 V;
- ±20 -
mV
VI = VVCO_IN = 0.5VCC; values taken over Rs range; see Figure 17
dynamic resistance
DEM_OUT; VCC = 4.5 V;
- 25 -
Rdyn
Ω
VDEM_OUT = 0.5VCC
General
supply current
disabled; VCC = 5.5 V;
- - 8.0 µA
ICC
pin INH at VCC
additional supply current
pin INH; VI = VCC − 2.1 V; VCC =
∆ICC
- 100 360 µA
4.5 V; other inputs at VCC or GND;
input capacitance
- 3.5 -
pF
CI Tamb = −40 °C to +85 °C Phase comparator section
3.15 -
- V
HIGH-level input voltage
pins SIG_IN and COMP_IN;
VIH
VCC = 4.5 V; DC coupled
VIL
- - 1.35 V
LOW-level input voltage
pins SIG_IN and COMP_IN; VCC = 4.5 V; DC coupled
16 of 43
Page 17
Table 5. Static characteristics …continued At recommended operating conditions; voltages are referenced to GND (ground = 0 V). Symbol
Parameter
Conditions
Min Typ Max Unit
VOH
HIGH-level output voltage
pins PCP_OUT and PCn_OUT; VCC = 4.5 V; VI = VIH or VIL IO = −20 µA
4.4 -
- V
IO = −4.0 mA
3.84 -
- V
LOW-level output voltage
pins PCP_OUT and PCn_OUT;
VOL
VCC = 4.5 V; VI = VIH or VIL IO = 20 µA
- - 0.1 V
IO = 4.0 mA
- - 0.33 V
- - ±38 µA
input leakage current
SIG_IN and COMP_IN;
II
VCC = 5.5 V; VI = VCC or GND
IOZ
OFF-state output current
PC2_OUT; VCC = 5.5 V;
- - ±5.0 µA
VI = VIH or VIL; VO = VCC or GND
VCO section
HIGH-level input voltage
pin INH; VCC = 4.5 V to 5.5 V;
2.0 -
- V
VIH
DC coupled
LOW-level input voltage
pin INH; VCC = 4.5 V to 5.5 V;
- - 0.8 V
VIL
DC coupled
HIGH-level output voltage
pin VCO_OUT; VCC = 4.5 V;
VOH
VI = VIH or VIL IO = −20 µA
4.4 -
- V
IO = −4.0 mA
3.84 -
- V
LOW-level output voltage
pin VCO_OUT; VCC = 4.5 V;
VOL
VI = VIH or VIL IO = 20 µA
- - 0.1 V
IO = 4.0 mA
- - 0.33 V
pins C1A and C1B; VCC = 4.5 V;
- - 0.47 V
VI = VIH or VIL; IO = 4.0 mA
- - ±1.0 µA
input leakage current
pins INH and VCO_IN;
II
VCC = 5.5 V; VI = VCC or GND
General ICC
supply current
disabled; VCC = 5.5 V;
- - 80.0 µA
pin INH at VCC
additional supply current
per input pin; VI = VCC − 2.1 V;
∆ICC
- - 450 µA
VCC = 4.5 V; other inputs at VCC or GND;
Tamb = −40 °C to +125 °C Phase comparator section
3.15 -
- V
HIGH-level input voltage
pins SIG_IN and COMP_IN;
VIH
VCC = 4.5 V; DC coupled
VIL
- - 1.35 V
LOW-level input voltage
pins SIG_IN and COMP_IN; VCC = 4.5 V; DC coupled
17 of 43
Page 18
Table 5. Static characteristics …continued At recommended operating conditions; voltages are referenced to GND (ground = 0 V). Symbol
Parameter
Conditions
Min Typ Max Unit
VOH
HIGH-level output voltage
pins PCP_OUT and PCn_OUT; VCC = 4.5 V; VI = VIH or VIL IO = −20 µA
4.4 -
- V
IO = −4.0 mA
3.7 -
- V
LOW-level output voltage
pins PCP_OUT and PCn_OUT;
VOL
VCC = 4.5 V; VI = VIH or VIL IO = 20 µA
- - 0.1 V
IO = 4.0 mA
- - 0.4 V
- - ±45 µA
input leakage current
pins SIG_IN and COMP_IN;
II
VCC = 5.5 V; VI = VCC or GND
IOZ
OFF-state output current
pin PC2_OUT; VCC = 5.5 V;
- - ±10.0 µA
VI = VIH or VIL; VO = VCC or GND
VCO section
HIGH-level input voltage
pin INH; VCC = 4.5 V to 5.5 V;
2.0 -
- V
VIH
DC coupled
LOW-level input voltage
pin INH; VCC = 4.5 V to 5.5 V;
- - 0.8 V
VIL
DC coupled
HIGH-level output voltage
pin VCO_OUT; VCC = 4.5 V;
VOH
VI = VIH or VIL IO = −20 µA
4.4 -
- V
IO = −4.0 mA
3.7 -
- V
LOW-level output voltage
pin VCO_OUT; VCC = 4.5 V;
VOL
VI = VIH or VIL IO = 20 µA
- - 0.1 V
IO = 4.0 mA
- - 0.4 V
pins C1A and C1B; VCC = 4.5 V;
- - 0.54 V
VI = VIH or VIL; IO = 4.0 mA
- - ±1.0 µA
input leakage current
pins INH and VCO_IN;
II
VCC = 5.5 V; VCC or GND
General ICC
supply current
disabled; VCC = 5.5 V;
- - 160.0 µA
pin INH at VCC
additional supply current
per input pin; VI = VCC − 2.1 V;
∆ICC
- - 490 µA
VCC = 4.5 V; other inputs at VCC or GND;
18 of 43
Page 19
| mbd108 II ∆VI self-bias operating point VI Fig 14. Typical input resistance curve at SIG_IN and COMP_IN | mga956 - 1 800 RI (kΩ) 600 400 VCC = 4.5 V 200 5.5 V 0 (0.5 VCC) − 0.25 0.5 VCC (0.5 VCC) + 0.25 VI (V) Fig 15. Input resistance at SIG_IN; COMP_IN with ∆V = 0.5 V at self-bias point I |
|---|---|
| mga957 5 VCC = 5.5V 4.5 V II (µA) 0 4.5 V 5.5 V −5 (0.5 VCC) − 0.25 0.5 VCC (0.5 VCC) + 0.25 VI (V) Fig 16. Input current at SIG_IN; COMP_IN with ∆V = 0.5 V at self-bias point I | mga958 60 Voffset (mV) 40 20 VCC = 4.5 V 0 5.5 V −20 −40 (0.5 VCC) − 2 0.5 VCC (0.5 VCC) + 2 VVCO_IN (V) ___ R = 50 kΩ s - - - R = 300 kΩ s Fig 17. Offset voltage at demodulator output as a function of VCO_IN and R s |
19 of 43
Page 20
12. Dynamic characteristics
Table 6. Dynamic characteristics[1] GND = 0 V; tr = tf = 6 ns; CL = 50 pF. Symbol
Parameter
Conditions
Min Typ Max Unit
Tamb = 25 °C Phase comparator section
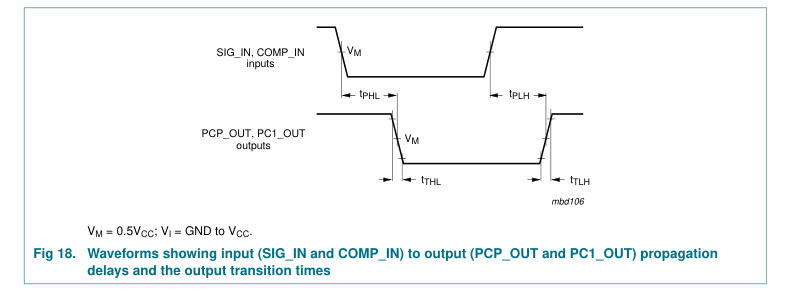
SIG_IN, COMP_IN to PC1_OUT;
- 23 40 ns
propagation delay
tpd
VCC = 4.5 V; see Figure 18 SIG_IN, COMP_IN to PCP_OUT;
- 35 68 ns
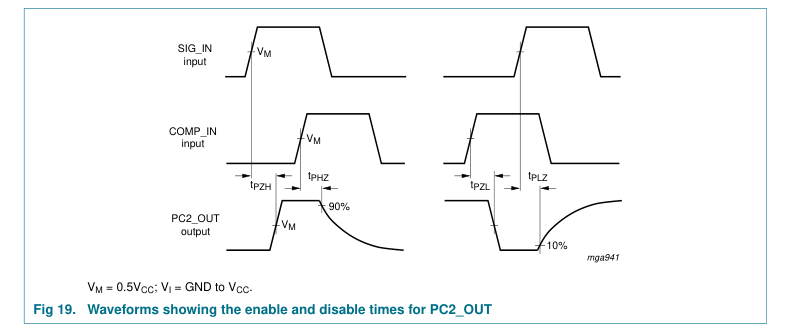
VCC = 4.5 V; see Figure 18 SIG_IN, COMP_IN to PC2_OUT;
enable time
- 30 56 ns
ten
VCC = 4.5 V; see Figure 19 SIG_IN, COMP_IN to PC2_OUT;
disable time
- 36 65 ns
tdis
VCC = 4.5 V; see Figure 19 VCC = 4.5 V; see Figure 18
transition time
- 7 15 ns
tt
[4] -
pin SIGN_IN or COMP_IN;
peak-to-peak input voltage
50 - mV
Vi(p-p)
VCC = 4.5 V; AC coupled; fi = 1 MHz
VCO section
[5] −10 -
VCC = 5.0 V; VVCO_IN = 3.9 V;
+10 %
∆f
frequency deviation
R1 = 10 kΩ; R2 = 10 kΩ; C1 = 1 nF VCC = 4.5 V; duty cycle = 50 %;
11.0 15.0 -
MHz
center frequency
f0
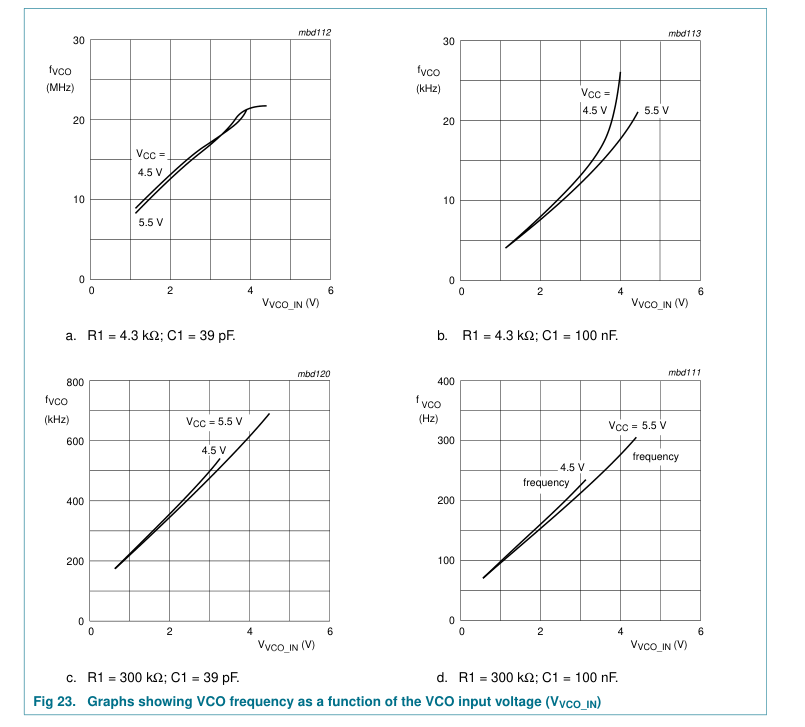
VVCO_IN = 0.5VCC; R1 = 4.3 kΩ; R2 = ∞Ω; C1 = 40 pF; see Figure 23 and 31 VCC = 5 V; duty cycle = 50 %;
- 16.0 -
MHz
VVCO_IN = 0.5VCC; R1 = 3 kΩ; R2 = ∞Ω; C1 = 40 pF; see Figure 23 and 31
[6] -
VCC = 4.5 V; R1 = 100 kΩ; R2 = ∞Ω;
∆f/f
relative frequency variation
0.4 -
%
C1 = 100 pF; see Figure 24 and 25 VCO_OUT; VCC = 4.5 V
- 50 - %
duty cycle
δ General
[2][3] -
power dissipation capacitance
20 - pF
CPD Tamb = −40 °C to +85 °C Phase comparator section
SIG_IN, COMP_IN to PC1_OUT;
- - 50 ns
propagation delay
tpd
VCC = 4.5 V; see Figure 18 SIG_IN, COMP_IN to PCP_OUT;
- - 85 ns
VCC = 4.5 V; see Figure 18 SIG_IN, COMP_IN to PC2_OUT;
ten
enable time
- - 70 ns
VCC = 4.5 V; see Figure 19 SIG_IN, COMP_IN to PC2_OUT;
disable time
- - 81 ns
tdis
VCC = 4.5 V; see Figure 19 VCC = 4.5 V; see Figure 18
transition time
- - 19 ns
tt VCO section
20 of 43
Page 21
Table 6. Dynamic characteristics[1] …continued GND = 0 V; tr = tf = 6 ns; CL = 50 pF. Symbol
Parameter
Conditions
Min Typ Max Unit [7] -
VCC = 4.5 V; VVCO_IN = 0.5VCC;
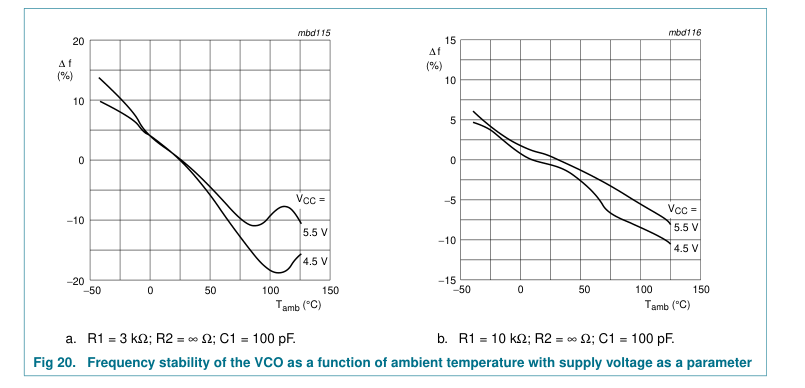
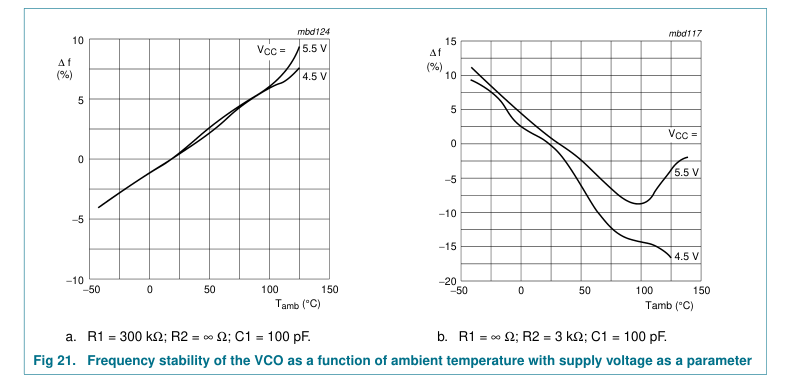
∆f/∆T
frequency variation with
0.06 -
%/K
recommended range: R1 = 10 kΩ;
temperature
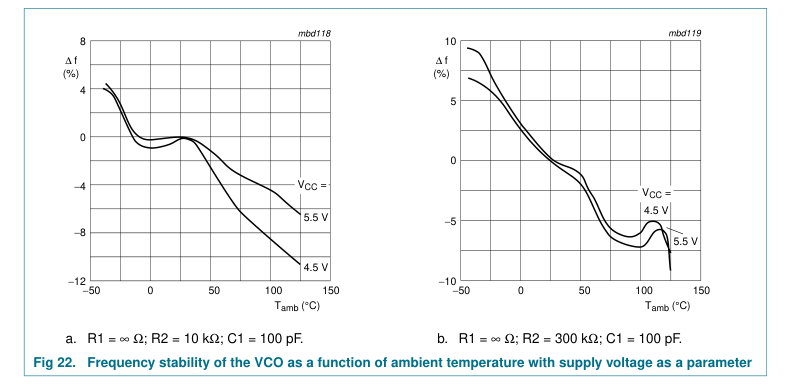
R2 = 10 kΩ; C1 = 1 nF; see Figure 20, 21 and 22
Tamb = −40 °C to +125 °C Phase comparator section
SIG_IN, COMP_IN to PC1_OUT;
- - 60 ns
propagation delay
tpd
VCC = 4.5 V; see Figure 18 SIG_IN, COMP_IN to PCP_OUT;
- - 102 ns
VCC = 4.5 V; see Figure 18 SIG_IN, COMP_IN to PC2_OUT;
ten
enable time
- - 84 ns
VCC = 4.5 V; see Figure 19 SIG_IN, COMP_IN to PC2_OUT;
- - 98 ns
disable time
tdis
VCC = 4.5 V; see Figure 19 VCC = 4.5 V; see Figure 18
tt
transition time
- - 22 ns
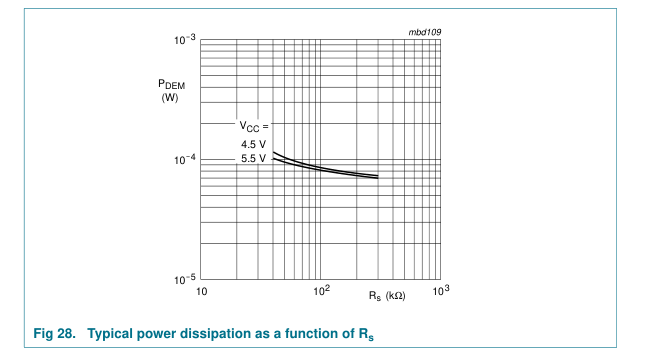
[1] tpd is the same as tPLH and tPHL; tdis is the same as tPLZ and tPHZ; ten is the same as tPZL and tPZH; tt is the same as tTLH and tTHL. [2] CPD is used to determine the dynamic power dissipation (PD in µW). PD = CPD × VCC2 × fi × N + ∑(CL × VCC2 × fo) where: fi = input frequency in MHz; fo = output frequency in MHz; CL = output load capacitance in pF; VCC = supply voltage in V; N = total load switching outputs; ∑(CL × VCC2 × fo) = sum of outputs. [3] Applies to the phase comparator section only (pin INH = HIGH). For power dissipation of the VCO and demodulator sections, see Figure 26, 27 and 28. [4] This is the (peak to peak) input sensitivity. [5] This is the center frequency tolerance.
[6] This is the frequency linearity. [7] This is the frequency stability with temperature change.
21 of 43
Page 22
22 of 43
Page 23
23 of 43
Page 24
24 of 43
Page 25
| mga937 f (MHz) f 2 f 0 f' 0 f1 V V min 0.5 VCC max VVCO_IN (V) -f ----+ ------f f‘ = -- -1 - -2 -- 0 2 f‘ 0– f 0 linearity = ------------------×100 % f 0 Fig 24. Definition of VCO frequency linearity: ∆V = 0.5 V over the V range CC | mbd114 4 C1 = 1 µF f VCO 4.5 V 5.5 V (%) 0 C1 = 39 pF 4.5 V −4 5.5 V −8 1 10 102 R1 (kΩ) 103 R2 = ∞Ω and ∆V = 0.5 V Fig 25. Frequency linearity as a function of R1, C1 and V CC |
|---|---|
| mbd121 1 VCC = PD 5.5 V (W) C1 = 1 µF 4.5 V C1 = 1 µF 10 1 5.5 V C1 = 39 pF 4.5 V C1 = 39 pF 10 2 0 100 200 R1 (kΩ) 300 R2 = ∞Ω Fig 26. Power dissipation as a function of R1 | mbd110 1 VCC = PD 5.5 V (W) C1 = 39 pF 4.5 V C1 = 39 pF 10 1 5.5 V 4.5 V C1 = 1 µF 10 2 0 100 200 300 R2 (kΩ) R1 = ∞Ω Fig 27. Power dissipation as a function of R2 |
25 of 43
Page 26
26 of 43
Page 27
13. Application information
This information is a guide for the approximation of values of external components to be used with the 74HCT9046A in a phase-locked-loop system.
Values of the selected components should be within the ranges shown in Table 7.
Table 7. Survey of components Component
Value between 3 kΩ and 300 kΩ
R1
between 3 kΩ and 300 kΩ
R2 R1 + R2
parallel value > 2.7 kΩ
C1
40 pF
Table 8. Design considerations for VCO section
Design consideration
Subject
Phase comparator
VCO frequency characteristic. With R2 = ∞ and R1 within the range
PC1, PC2
VCO frequency
3 kΩ < R1 < 300 kΩ, the characteristics of the VCO operation will be as
without extra
shown in Figure 29a. (Due to R1, C1 time constant a small offset remains
offset
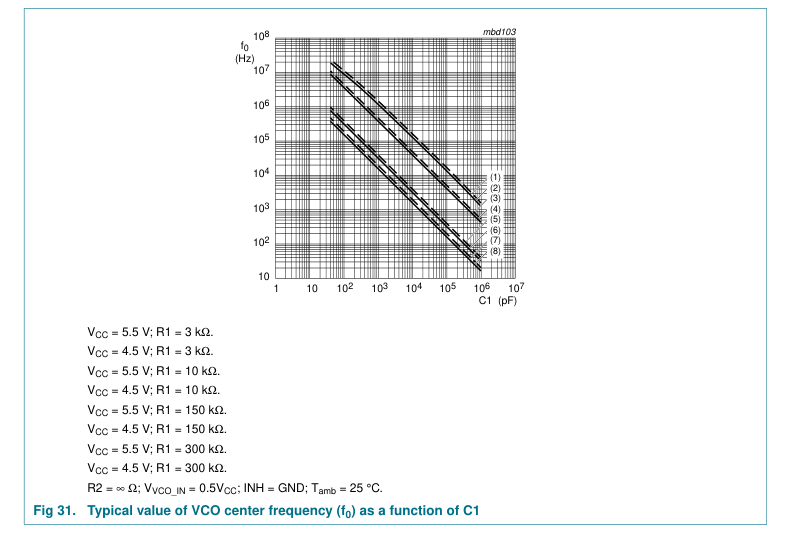
when R2 = ∞Ω). Selection of R1 and C1. Given f0, determine the values of R1 and C1 using
PC1
Figure 31. Given fmax and f0 determine the values of R1 and C1 using Figure 31; use
PC2
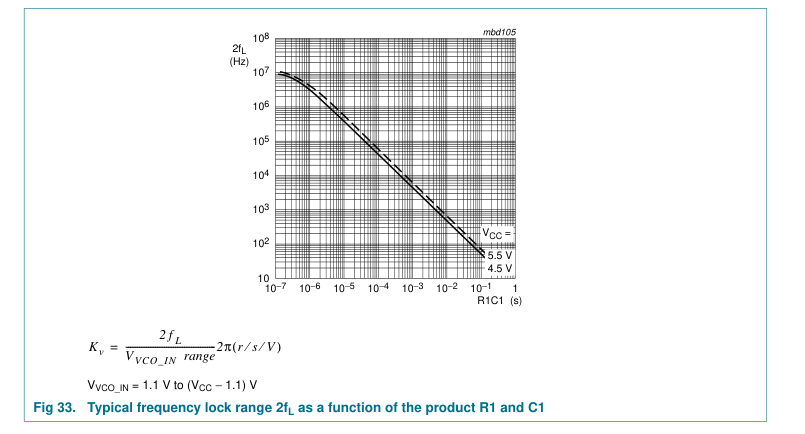
Figure 33 to obtain 2fL and then use this to calculate fmin. VCO frequency characteristic. With R1 and R2 within the ranges
VCO frequency
PC1, PC2
3 kΩ < R1 < 300 kΩ < R2 < 300 kΩ, the characteristics of the VCO
with extra offset
operation is as shown in Figure 29b. Selection of R1, R2 and C1. Given f0 and fL determine the value of product
PC1, PC2
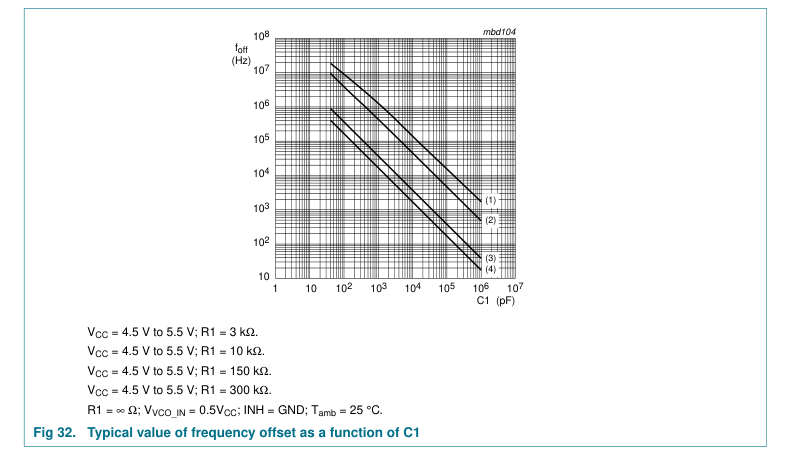
R1C1 by using Figure 33. Calculate foff from the equation foff = f0 − 1.6fL. Obtain the values of C1 and R2 by using Figure 32. Calculate the value of R1 from the value of C1 and the product R1C1. VCO adjusts to f0 with ΦPC_IN = 90° and VVCO_IN = 0.5VCC
PLL conditions with PC1 no signal at pin
VCO adjusts to foffset with ΦPC_IN = −360° and VVCO_IN = minimum
PC2
SIG_IN
27 of 43
Page 28
28 of 43
Page 29
13.1 Filter design considerations for PC1 and PC2 of the 74HCT9046A
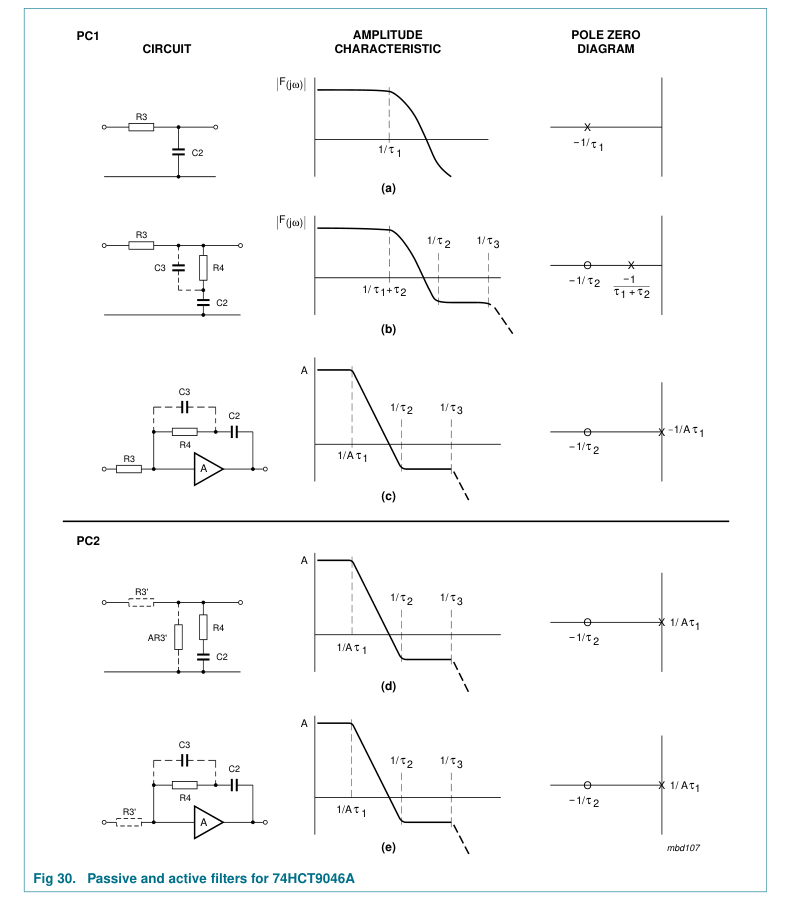
Figure 30 shows some examples of passive and active filters to be used with the phase comparators of the 74HCT9046A. Transfer functions of phase comparators and filters are given in Table 9.
Table 9. Transfer functions of phase comparators and filters Phase
Explanation
Figure
Filter type
comparator
Figure 30a passive filter without
PC1
VCC = -----------V/r KPC1
damping
π τ1 = R3 × C2;
Figure 30b passive filter with
damping
τ2 = R4 × C2; τ3 = R4 × C3; A = 105 = DC gain
Figure 30c active filter with
amplitude
damping
Figure 30d passive filter with
PC2
5 + ------V/r KPC
damping
4π τ1 = R3’ × C2; τ2 = R4 × C2;
Figure 30e active filter with
τ3 = R4 × C3;
damping
R3' = Rbias/17; Rbias = 25 kΩ to 250 kΩ
Table 10. General design considerations Subject
Phase comparator
Design consideration
PLL locks on harmonics at
PC1
yes
center frequency
PC2
no
Noise rejection at signal input PC1
high
PC2
low
Transfer function
1 = --------------------- F jω ( ) 1 + jωτ1
1 + jωτ2 = -------------------------------------- F jω ( ) 1 + ( + ) jω τ1 τ2
+ + jωτ2 jωτ2
1 1
= ---------------------------- --------------------- ≈
F jω ( ) 1/A + jωτ1 jωτ1
1 + 1 + jωτ2 jωτ2
= ----------------------------- ≈ --------------------- F jω ( ) 1 A ⁄ + jωτ1 jωτ1 A = 105 = DC gain amplitude 1 + 1 + jωτ2 jωτ2
= ---------------------------- ≈ --------------------- F jω ( ) 1/A + jωτ1 jωτ1 A = 105 = DC gain amplitude
fr = 2fi; large ripple content at ΦPC_IN = 90°
AC ripple content when PLL is PC1 locked
fr = fi; small ripple content at ΦPC_IN = 0°
PC2
29 of 43
Page 30
30 of 43
Page 31
31 of 43
Page 32
32 of 43
Page 33
13.2 PLL design example
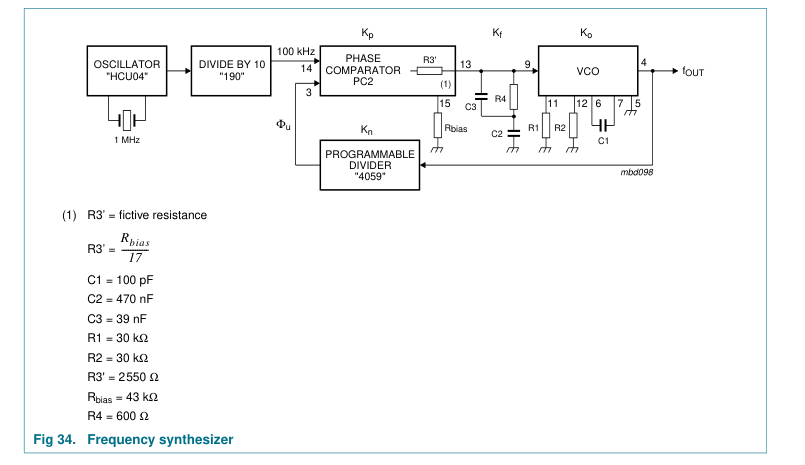
The frequency synthesizer used in the design example shown in Figure 34 has the following parameters:
Output frequency: 2 MHz to 3 MHz Frequency steps: 100 kHz Settling time: 1 ms Overshoot: < 20 %
The open loop gain is:
H(s) × G(s) = × × ×
K p K f Ko Kn
and the closed loop:
Φu
× × × K p K f Ko Kn ------- = -------------------------------------------------------- 1 + × × × Φi K p K f Ko Kn
where:
Kp = phase comparator gain Kf = low-pass filter transfer gain Ko = Kv/s VCO gain Kn = 1⁄n divider ratio The programmable counter ratio Kn can be found as follows:
f OUT 2 MHz = =
= 20
------------- -------------------- Nmin fstep 100 kHz
f OUT 3 MHz = ------------- = --------------------- = 30 Nmax f step 100 kHz
The VCO is set by the values of R1, R2 and C1; R2 = 10 kΩ (adjustable).
The values can be determined using the information in Table 8.
With f0 = 2.5 MHz and fL = 500 kHz this gives the following values (VCC = 5.0 V): R1 = 30 kΩ R2 = 30 kΩ C1 = 100 pF
The VCO gain is:
× 2π 2 f L
1 MHz 2π ≈ 2.24 × 10⁶r s V
= ------------------------------------------ = ----------------- ×
⁄ ⁄
Kv
– 1.1) – 1.1 (
2.8
V CC
The gain of the phase comparator PC2 is:
33 of 43
Page 34
5 = = 0.4 V r ------------
⁄
K p 4 × π
Using PC2 with the passive filter as shown in Figure 34 results in a high gain loop with the same performance as a loop with an active filter. Hence loop filter equations as for a high gain loop should be used. The current source output of PC2 can be simulated then with a fictive filter resistance:
Rbias R3‘ = ------------ 17
The transfer functions of the filter is given by:
1 + sτ2 = ----------------- K f sτ2
Where:
= R3‘ × C2 τ1
= R4 × C2 τ2
The characteristic equation is: 1 +
× × × K p K f Ko Kn
This results in:
1 + sτ2 Kv
1 +
= 0
----------------- s------Kn K p sτ1
or:
τ2
s2 +
+ ⁄ = 0
----- K pKvKn τ1
sK pKvKn τ1
This can be written as:
s2 + + ( )2 = 0 2ξωns ωn
with the natural frequency ωn defined as:
× × K p Kv Kn = --------------------------------- ωn
τ1
and the damping value given as: ζ
= 0.5 × × τ2 ωn
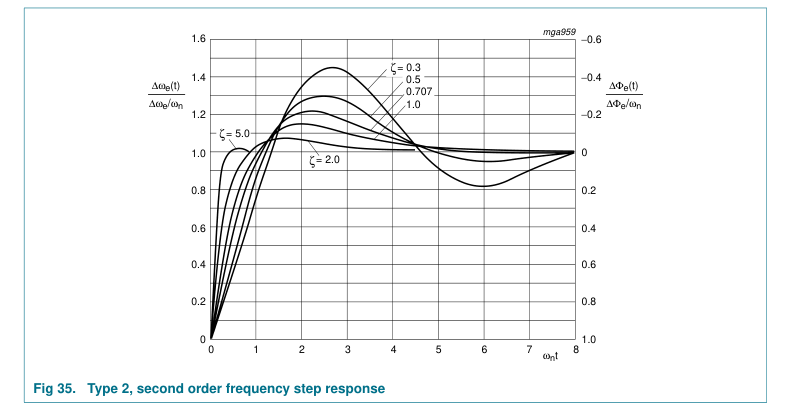
In Figure 35 the output frequency response to a step of input frequency is shown.
The overshoot and settling time percentages are now used to determine ωn. From Figure 35 it can be seen that the damping ratio ζ = 0.707 will produce an overshoot of less than 20 % and settle to within 5 % at ωnt = 5. The required settling time is 1 ms. This results in:
34 of 43
Page 35
5 5 = 5 103r s
= = t-- 0.001 ------------- ωn
× ⁄
Rewriting the equation for natural frequency results in:
× × K p Kv Kn = --------------------------------- τ1 ( )2 ωn
The maximum overshoot occurs at Nmax = 30; hence Kn = 1⁄30:
0.4 × 2.24 × 106 =
= 0.0012
--------------------------------------- τ1 50002 × 30
When C2 = 470 nF, it follows:
τ1 0.0012
R3‘ = ------- = -------------------------- = 2550 Ω
–
C2 470 × 10 9
Hence the current source bias resistance
= 17 × 2550 = 43 kΩ Rbias
With ζ = 0.707 (0.5 × τ2 × ωn) it follows:
0.707 =
= 0.00028 ------------------------- τ2 × 0.5 5000
τ2 0.00028
R4 = =
= 600 Ω
------- --------------------------
–
C2 470 10 9 ×
For extra ripple suppression a capacitor C3 can be connected in parallel with R4, with an extra τ3 = R4 × C3. For stability reasons τ3 should be < 0.1τ2, hence C3 < 0.1C2 or C3 = 39 nF.
35 of 43
Page 36
36 of 43
Page 37
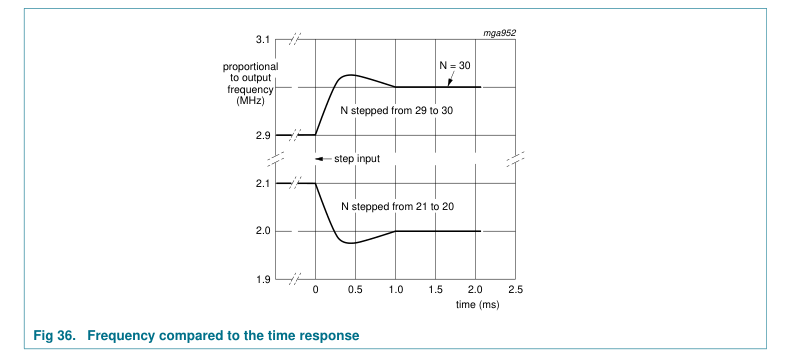
Since the output frequency is proportional to the VCO control voltage, the PLL frequency response can be observed with an oscilloscope by monitoring pin VCO_IN of the VCO. The average frequency response, as calculated by the Laplace method, is found experimentally by smoothing this voltage at pin VCO_IN with a simple RC filter, whose time constant is long compared with the phase detector sampling rate but short compared with the PLL response time.
13.3 Further information
For an extensive description and application example please refer to “Application note” ordering number 9397 750 00078.
37 of 43
Page 38
14. Package outline
DIP16: plastic dual in-line package; 16 leads (300 mil)
SOT38-4
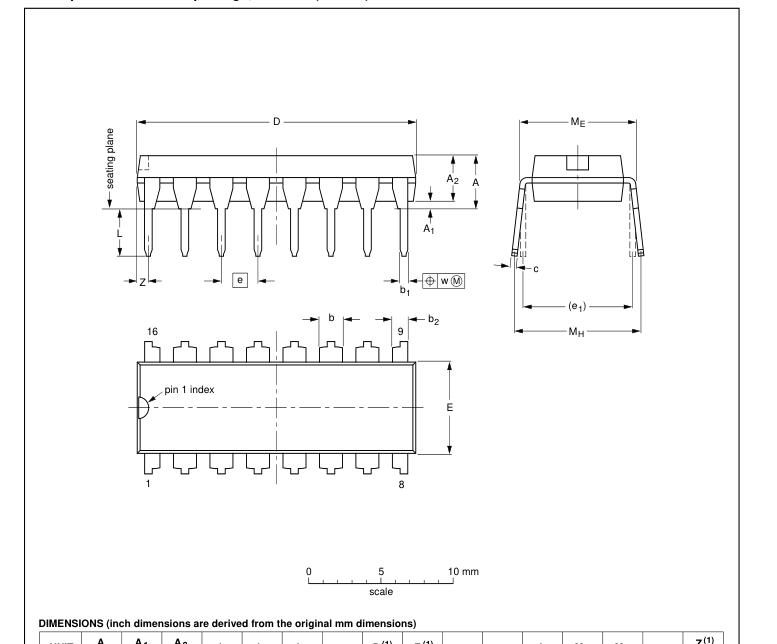

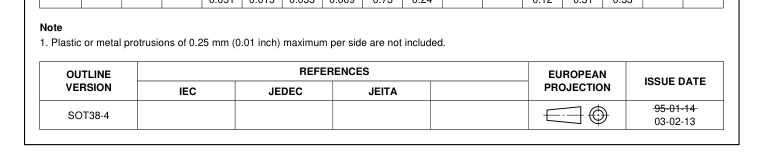
Fig 37. Package outline SOT38-4 (DIP16)
38 of 43
Page 39
SO16: plastic small outline package; 16 leads; body width 3.9 mm
SOT109-1
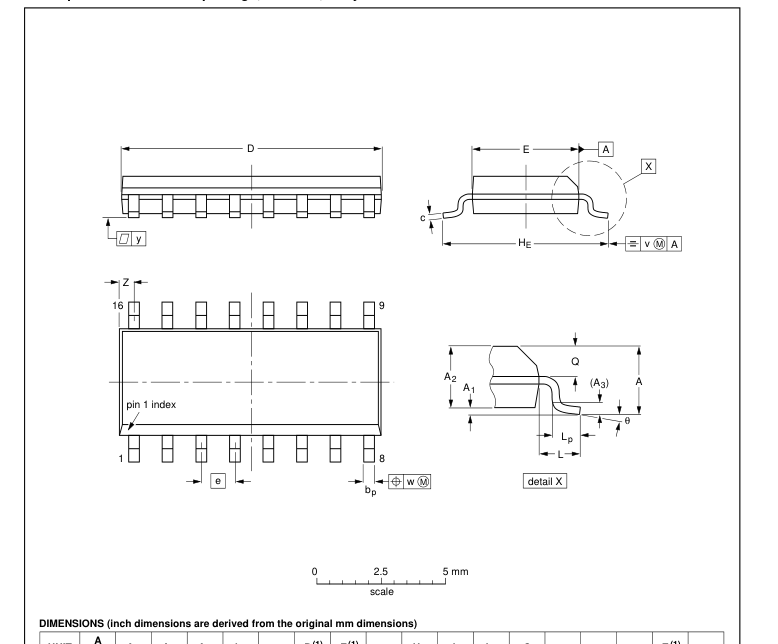

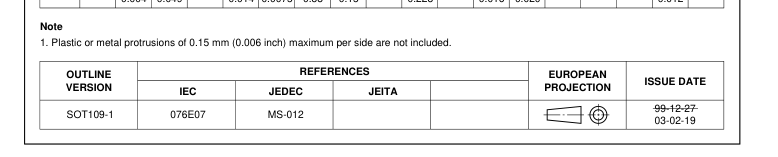
Fig 38. Package outline SOT109-1 (SO16)
39 of 43
Page 40
TSSOP16: plastic thin shrink small outline package; 16 leads; body width 4.4 mm
SOT403-1
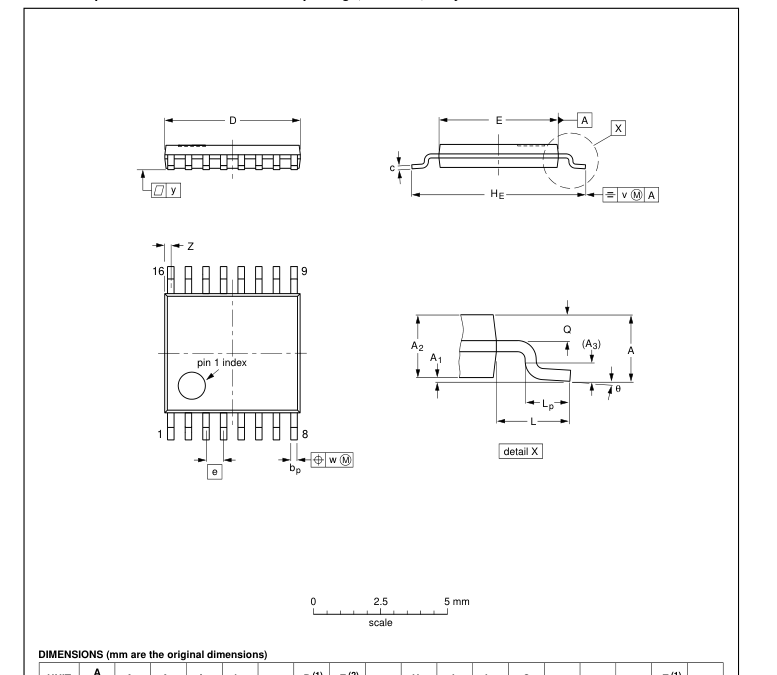

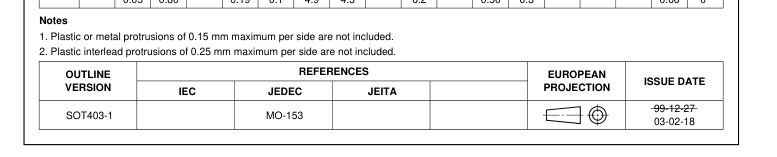
Fig 39. Package outline SOT403-1 (TSSOP16)
40 of 43
Page 41
15. Abbreviations
Table 11. Abbreviations Acronym
Description
CMOS
Complementary Metal Oxide Semiconductor
DUT
Device Under Test
ESD
ElectroStatic Discharge
HBM
Human Body Model
MM
Machine Model
PLL
Phase Locked Loop
VCO
Voltage Controlled Oscillator
16. Revision history
Table 12. Revision history Document ID
Release date
Data sheet status
Change notice
Supersedes
20090915
-
74HCT9046A_5
- The format of this data sheet has been redesigned to comply with the new identity
Modifications:
guidelines of NXP Semiconductors.
- Legal texts have been adapted to the new company name where appropriate.
- Vi(p-p) value changed from 15 mV to 50 mV in Section 12.
- ∆f/∆T value moved from minimum to typical column Section 12.
- Package version SOT38-1 changed to SOT38-4 in Section 4 and Figure 37.
74HCT9046A_5
20031030
Product specification
-
74HCT9046A_4
74HCT9046A_4
20030515
Product specification
-
74HCT9046A_3
74HCT9046A_3
19990111
Product specification
-
-
41 of 43
Page 42
17. Legal information
17.1 Data sheet status
Document status[1][2]
Product status[3]
Definition This document contains data from the objective specification for product development.
Objective [short] data sheet
Development
This document contains data from the preliminary specification.
Preliminary [short] data sheet Qualification
This document contains the product specification.
Product [short] data sheet
Production
[1] Please consult the most recently issued document before initiating or completing a design. [2] The term ‘short data sheet’ is explained in section “Definitions”. [3] The product status of device(s) described in this document may have changed since this document was published and may differ in case of multiple devices. The latest product status information is available on the Internet at URL http://www.nxp.com.
17.2 Definitions
Draft — The document is a draft version only. The content is still under internal review and subject to formal approval, which may result in modifications or additions. NXP Semiconductors does not give any representations or warranties as to the accuracy or completeness of information included herein and shall have no liability for the consequences of use of such information. Short data sheet — A short data sheet is an extract from a full data sheet with the same product type number(s) and title. A short data sheet is intended for quick reference only and should not be relied upon to contain detailed and full information. For detailed and full information see the relevant full data
sheet, which is available on request via the local NXP Semiconductors sales office. In case of any inconsistency or conflict with the short data sheet, the full data sheet shall prevail.
17.3 Disclaimers
General — Information in this document is believed to be accurate and reliable. However, NXP Semiconductors does not give any representations or warranties, expressed or implied, as to the accuracy or completeness of such information and shall have no liability for the consequences of use of such information. Right to make changes — NXP Semiconductors reserves the right to make changes to information published in this document, including without limitation specifications and product descriptions, at any time and without notice. This document supersedes and replaces all information supplied prior to the publication hereof. Suitability for use — NXP Semiconductors products are not designed,
authorized or warranted to be suitable for use in medical, military, aircraft, space or life support equipment, nor in applications where failure or malfunction of an NXP Semiconductors product can reasonably be expected to result in personal injury, death or severe property or environmental
18. Contact information
For more information, please visit: http://www.nxp.com
damage. NXP Semiconductors accepts no liability for inclusion and/or use of NXP Semiconductors products in such equipment or applications and therefore such inclusion and/or use is at the customer’s own risk. Applications — Applications that are described herein for any of these products are for illustrative purposes only. NXP Semiconductors makes no representation or warranty that such applications will be suitable for the specified use without further testing or modification. Limiting values — Stress above one or more limiting values (as defined in the Absolute Maximum Ratings System of IEC 60134) may cause permanent damage to the device. Limiting values are stress ratings only and operation of
the device at these or any other conditions above those given in the Characteristics sections of this document is not implied. Exposure to limiting values for extended periods may affect device reliability. Terms and conditions of sale — NXP Semiconductors products are sold subject to the general terms and conditions of commercial sale, as published at http://www.nxp.com/profile/terms, including those pertaining to warranty, intellectual property rights infringement and limitation of liability, unless explicitly otherwise agreed to in writing by NXP Semiconductors. In case of any inconsistency or conflict between information in this document and such terms and conditions, the latter will prevail.
No offer to sell or license — Nothing in this document may be interpreted or construed as an offer to sell products that is open for acceptance or the grant, conveyance or implication of any license under any copyrights, patents or other industrial or intellectual property rights. Export control — This document as well as the item(s) described herein may be subject to export control regulations. Export might require a prior authorization from national authorities.
17.4 Trademarks
Notice: All referenced brands, product names, service names and trademarks are the property of their respective owners.
For sales office addresses, please send an email to: salesaddresses@nxp.com
42 of 43
Page 43
19. Contents
1 General description . . . . . . . . . . . . . . . . . . . . . . 1 2 Features . . . . . . . . . . . . . . . . . . . . . . . . . . . . . . . 1 3 Applications . . . . . . . . . . . . . . . . . . . . . . . . . . . . 2 4 Ordering information . . . . . . . . . . . . . . . . . . . . . 2 5 Block diagram . . . . . . . . . . . . . . . . . . . . . . . . . . 3 6 Functional diagram . . . . . . . . . . . . . . . . . . . . . . 3 7 Pinning information. . . . . . . . . . . . . . . . . . . . . . 5 7.1 Pinning . . . . . . . . . . . . . . . . . . . . . . . . . . . . . . . 5 7.2 Pin description . . . . . . . . . . . . . . . . . . . . . . . . . 5 8 Functional description . . . . . . . . . . . . . . . . . . . 6
8.1 Differences with respect to the familiar 74HCT4046A . . . . . . . . . . . . . . . . . . . . . . . . . . 6 8.2 VCO . . . . . . . . . . . . . . . . . . . . . . . . . . . . . . . . . 7 8.3 Phase comparators. . . . . . . . . . . . . . . . . . . . . . 7 8.3.1 Phase Comparator 1 (PC1) . . . . . . . . . . . . . . . 7 8.3.2 Phase Comparator 2 (PC2) . . . . . . . . . . . . . . . 9 8.4 Loop filter component selection . . . . . . . . . . . 13 9 Limiting values. . . . . . . . . . . . . . . . . . . . . . . . . 14 10 Recommended operating conditions. . . . . . . 15 11 Static characteristics. . . . . . . . . . . . . . . . . . . . 15 12 Dynamic characteristics . . . . . . . . . . . . . . . . . 20
13 Application information. . . . . . . . . . . . . . . . . . 27 13.1 Filter design considerations for PC1 and PC2 of the 74HCT9046A . . . . . . . . . . . . . . . . 29 13.2 PLL design example . . . . . . . . . . . . . . . . . . . . 33 13.3 Further information . . . . . . . . . . . . . . . . . . . . . 37 14 Package outline . . . . . . . . . . . . . . . . . . . . . . . . 38 15 Abbreviations. . . . . . . . . . . . . . . . . . . . . . . . . . 41 16 Revision history. . . . . . . . . . . . . . . . . . . . . . . . 41 17 Legal information. . . . . . . . . . . . . . . . . . . . . . . 42 17.1 Data sheet status . . . . . . . . . . . . . . . . . . . . . . 42 17.2 Definitions. . . . . . . . . . . . . . . . . . . . . . . . . . . . 42
17.3 Disclaimers . . . . . . . . . . . . . . . . . . . . . . . . . . . 42 17.4 Trademarks. . . . . . . . . . . . . . . . . . . . . . . . . . . 42 18 Contact information. . . . . . . . . . . . . . . . . . . . . 42 19 Contents . . . . . . . . . . . . . . . . . . . . . . . . . . . . . . 43

Please be aware that important notices concerning this document and the product(s) described herein, have been included in section ‘Legal information’.
© NXP B.V. 2009.
All rights reserved.
For more information, please visit: http://www.nxp.com For sales office addresses, please send an email to: salesaddresses@nxp.com
Date of release: 15 September 2009 Document identifier: 74HCT9046A_6