


 Download PDF
74HC7403 PHILIPS
Document overview
- PDF pages: 28
Technical content
Page 1
Page 2
| SYMBOL | PARAMETER | CONDITIONS | TYP. | UNIT | |
|---|---|---|---|---|---|
| HC | HCT | ||||
| t /t PHL PLH | propagation delay SO, SI to DIR and DOR | C = 15 pF; L V = 5 V CC | 15 | 17 | ns |
| f max | maximum clock frequency | 30 | 30 | MHz | |
| C I | input capacitance | 3.5 | 3.5 | pF | |
| C PD | power dissipation capacitance per package | note 1 | 475 | 490 | pF |

| EXTENDED TYPE NUMBER | PACKAGE | |||
|---|---|---|---|---|
| PINS | PIN POSITION | MATERIAL | CODE | |
| 74HC/HCT7403N | 16 | DIL | plastic | SOT38Z |
| 74HC/HCT7403D | 16 | SO16L | plastic | SOT162 |
Page 3
| SYMBOL | PIN | DESCRIPTION |
|---|---|---|
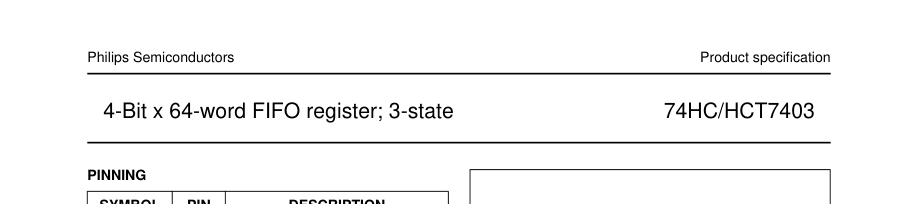
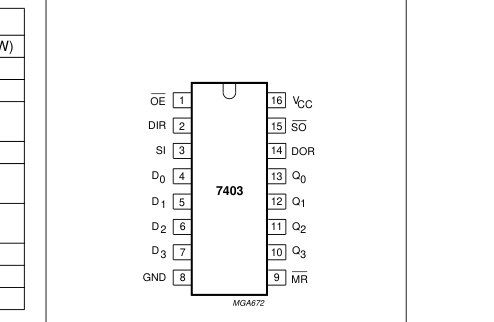
| OE | 1 | output enable input (active LOW) |
| DIR | 2 | data-in-ready output |
| SI | 3 | shift-in input (active HIGH) |
| D to D O 3 | 4, 5, 6, 7 | parallel data input |
| GND | 8 | ground |
| MR | 9 | asynchronous master-reset input (active LOW) |
| Q to Q 3 0 | 10, 11, 12, 13 | data output |
| DOR | 14 | data-out-ready output |
| SO | 15 | shift-out input (active LOW) |
| V CC | 16 | positive supply voltage |
Page 4
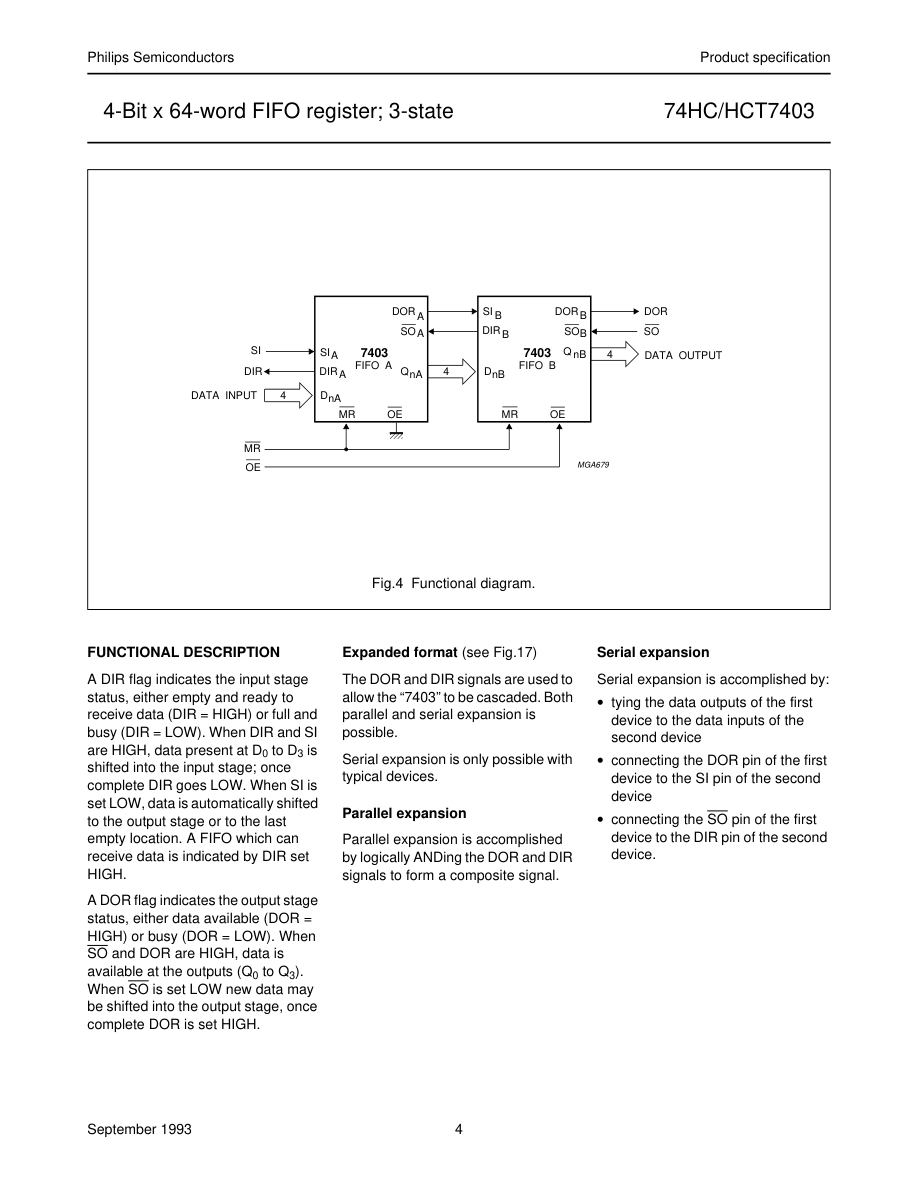
Page 5

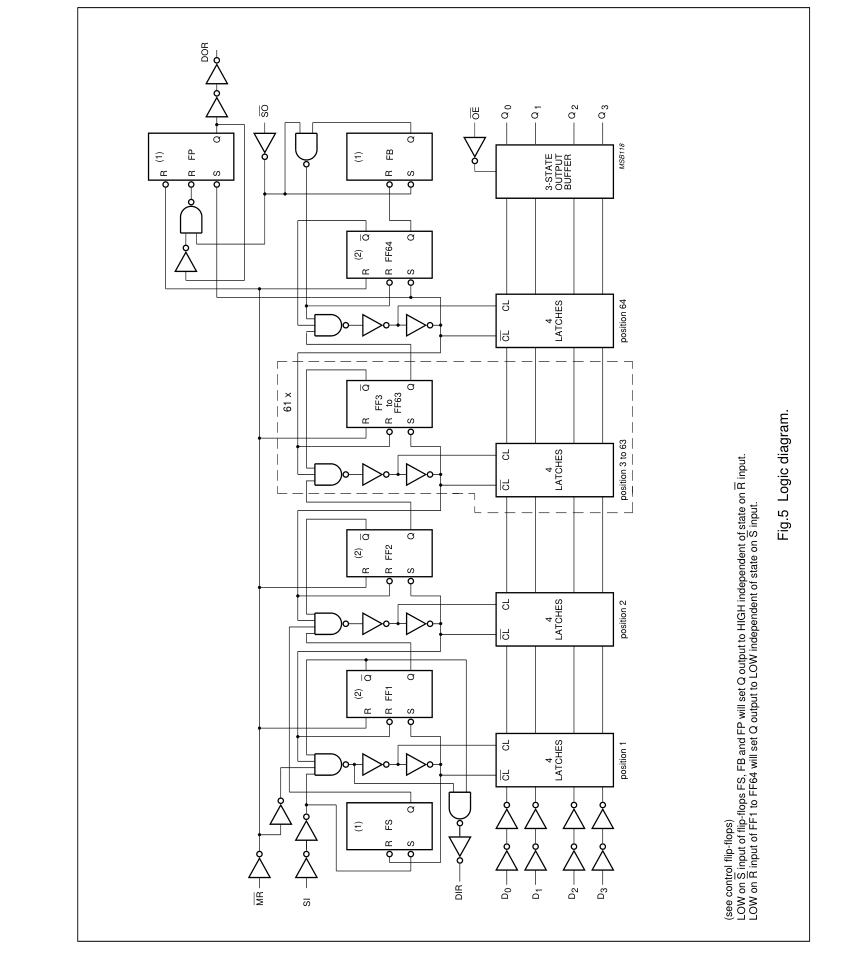
Page 6
Page 7

Page 8

Page 9
| SYMBOL | PARAMETER | T (°C) amb | UNIT | TEST CONDITION | ||||||||
|---|---|---|---|---|---|---|---|---|---|---|---|---|
| +25 | −40 to +85 | −40 to +125 | V CC (V) | V I | OTHER | |||||||
| MIN | TYP | MAX | MIN | MAX | MIN | MAX | ||||||
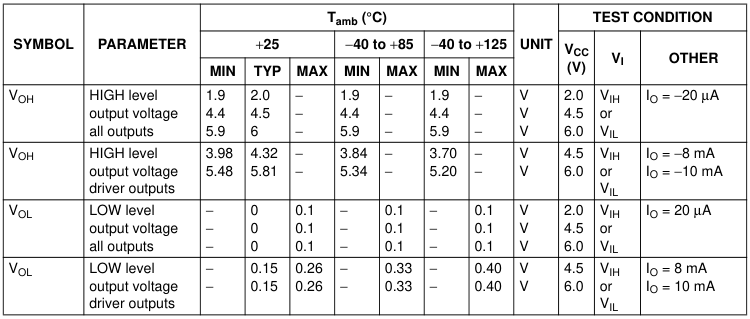
| V OH | HIGH level output voltage all outputs | 4.4 | 4.5 | − | 4.4 | − | 4.4 | − | V | 4.5 | V IH or V IL | I = −20 µA O |
| V OH | HIGH level output voltage driver outputs | 3.98 | 4.32 | − | 3.84 | − | 3.7 | − | V | 4.5 | V IH or V IL | I = −8 mA O |
| V OL | LOW level output voltage all outputs | − | 0 | 0.1 | − | 0.1 | − | 0.1 | V | 4.5 | V IH or V IL | I = 20 µA O |
| V OL | LOW level output voltage driver outputs | − | 0.15 | 0.26 | − | 0.33 | − | 0.4 | V | 4.5 | V IH or V IL | I = 8 mA O |

| INPUT | UNIT LOAD COEFFICIENT |
|---|---|
| OE | 1 |
| SI | 1.5 |
| D n | 0.75 |
| MR | 1.5 |
| SO | 1.5 |
Page 10
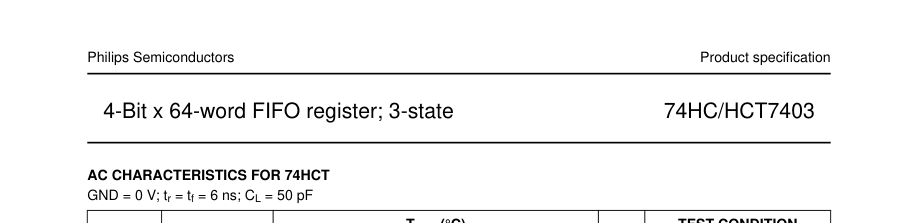
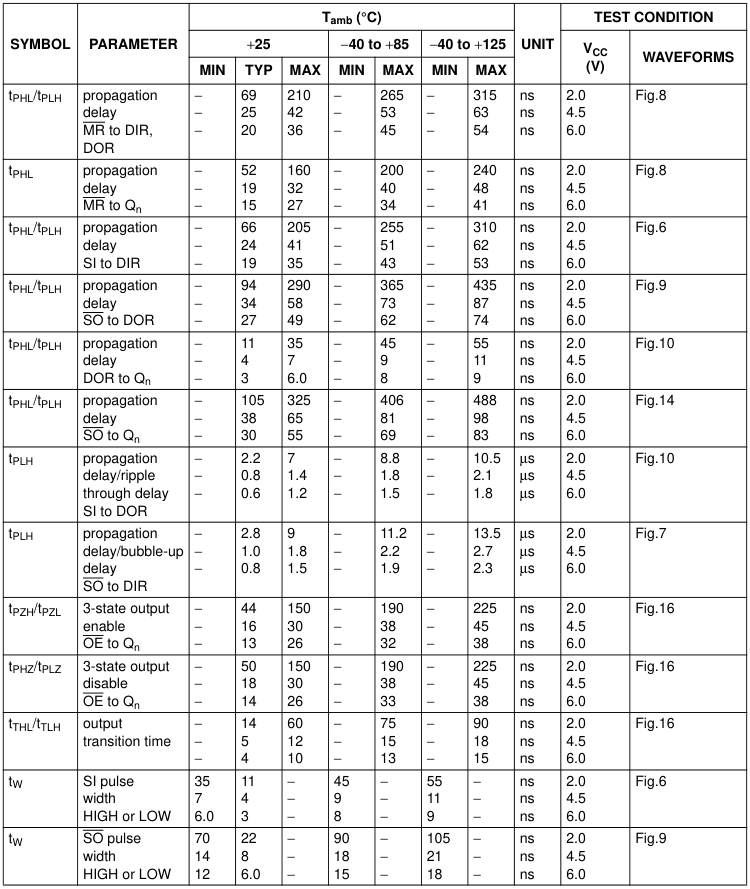
| SYMBOL | PARAMETER | T (°C) amb | UNIT | TEST CONDITION | |||||||
|---|---|---|---|---|---|---|---|---|---|---|---|
| −25 | −40 to +85 | −40 to +125 | V CC (V) | WAVEFORMS | |||||||
| MIN | TYP | MAX | MIN | MAX | MIN | MAX | |||||
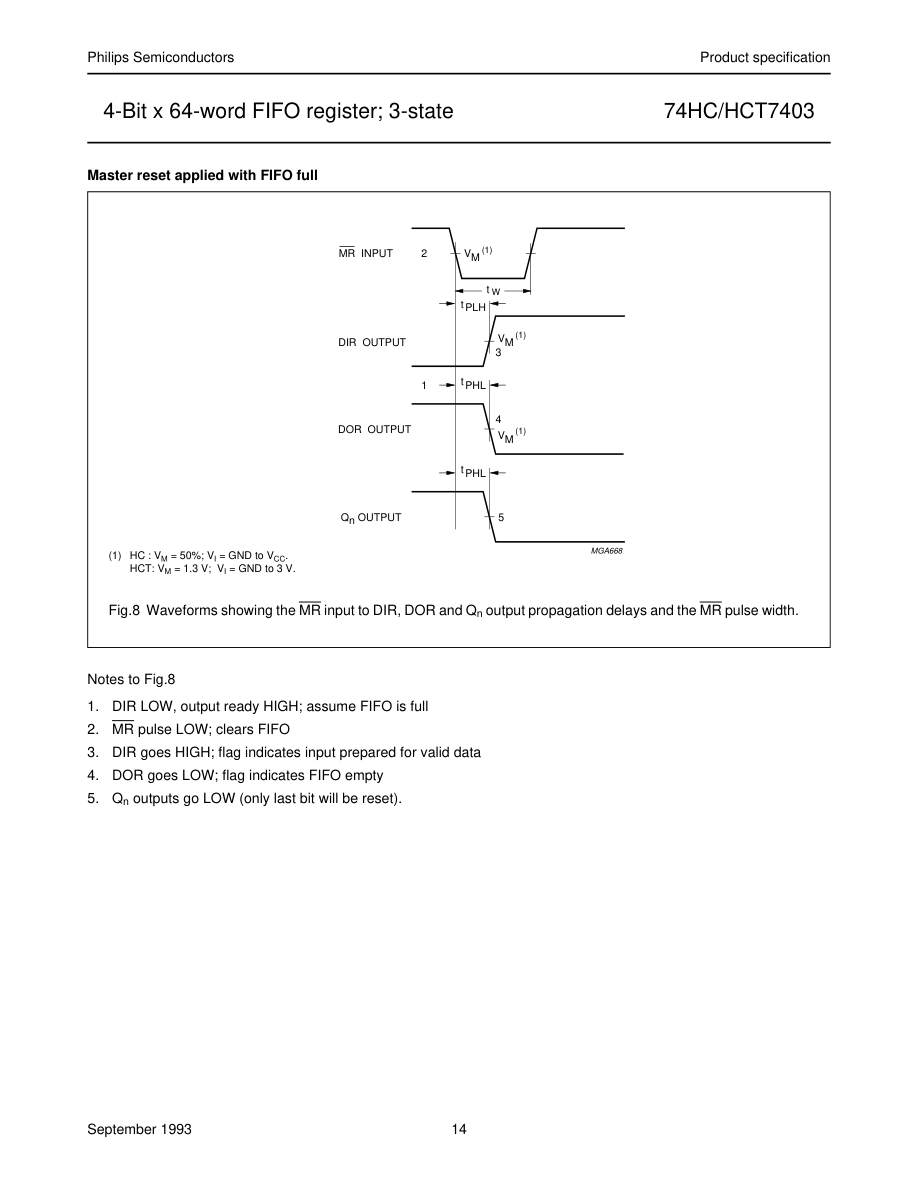
| t /t PHL PLH | propagation delay MR to DIR, DOR | − | 30 | 51 | − | 53 | − | 63 | ns | 4.5 | Fig.8 |
| t PHL | propagation delay MR to Q n | − | 22 | 38 | − | 48 | − | 57 | ns | 4.5 | Fig.8 |
| t /t PHL PLH | propagation delay SI to DIR | − | 25 | 43 | − | 54 | − | 65 | ns | 4.5 | Fig.6 |
| t /t PHL PLH | propagation delay SO to DOR | − | 36 | 61 | − | 76 | − | 92 | ns | 4.5 | Fig.9 |
| t /t PHL PLH | propagation delay SO to Q n | − | 42 | 72 | − | 90 | − | 108 | ns | 4.5 | Fig.14 |
| t /t PHL PLH | propagation delay DOR to Q n | − | 7 | 12 | − | 15 | − | 18 | ns | 4.5 | Fig.10 |
| t PLH | propagation delay/ripple through delay SI to DOR | − | 0.8 | 1.4 | − | 1.75 | − | 2.1 | µs | 4.5 | Fig.10 |
| t PLH | propagation delay/bubble-up delay SO to DIR | − | 1 | 1.8 | − | 2.25 | − | 2.7 | µs | 4.5 | Fig.7 |
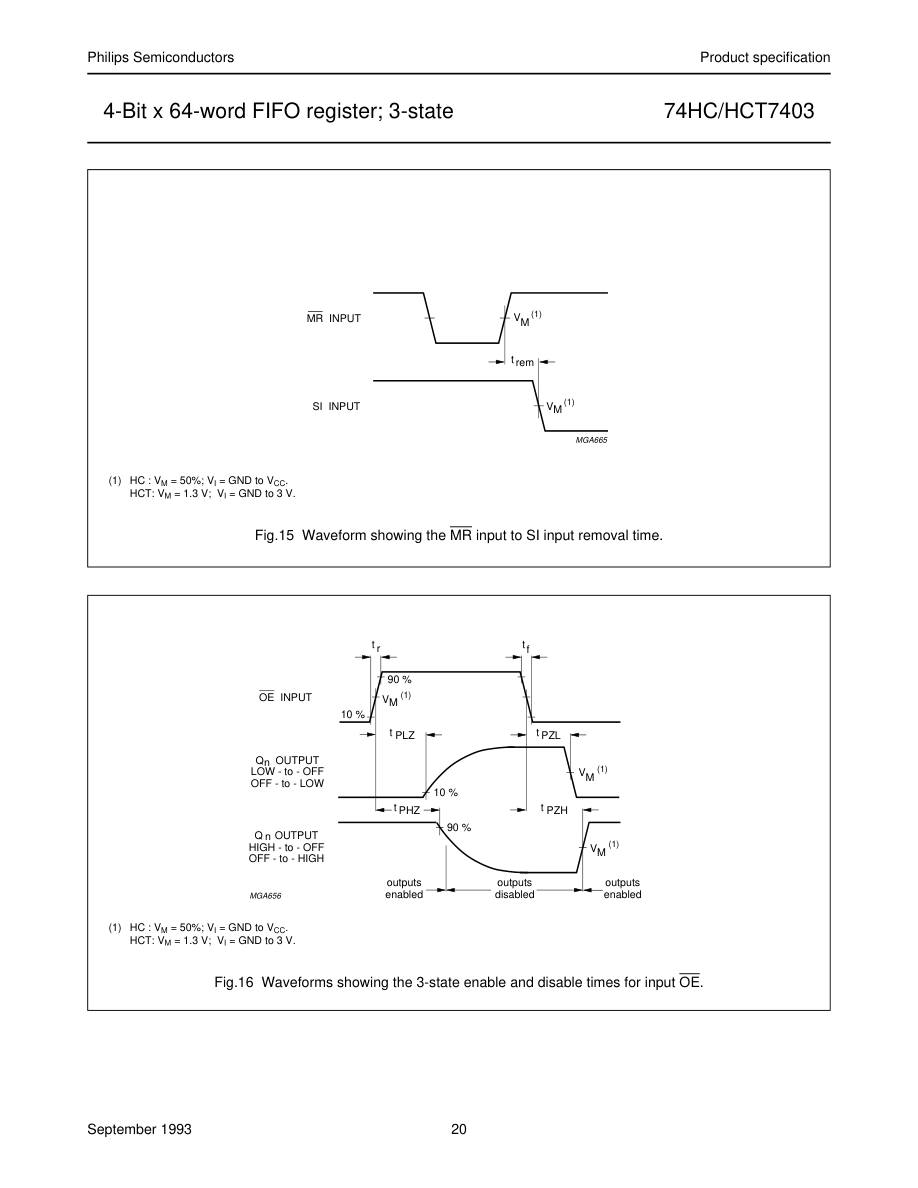
| t /t PZH PZL | 3-state output enable time OE to Q n | − | 16 | 30 | − | 38 | − | 45 | ns | 4.5 | Fig.16 |
| t /t PHZ PLZ | 3-state output disable time OE to Q n | − | 19 | 30 | − | 38 | − | 45 | ns | 4.5 | Fig.16 |
| t /t THL TLH | output transition time | − | 5 | 12 | − | 15 | − | 18 | ns | 4.5 | Fig.16 |
| t W | SI pulse width HIGH or LOW | 9 | 5 | − | 6 | − | 8 | − | ns | 4.5 | Fig.6 |
| t W | SO pulse width HIGH or LOW | 14 | 8 | − | 18 | − | 21 | − | ns | 4.5 | Fig.9 |
| t W | DIR pulse width HIGH | 5 | 17 | 29 | 4 | 36 | 4 | 44 | ns | 4.5 | Fig.7 |

Page 11

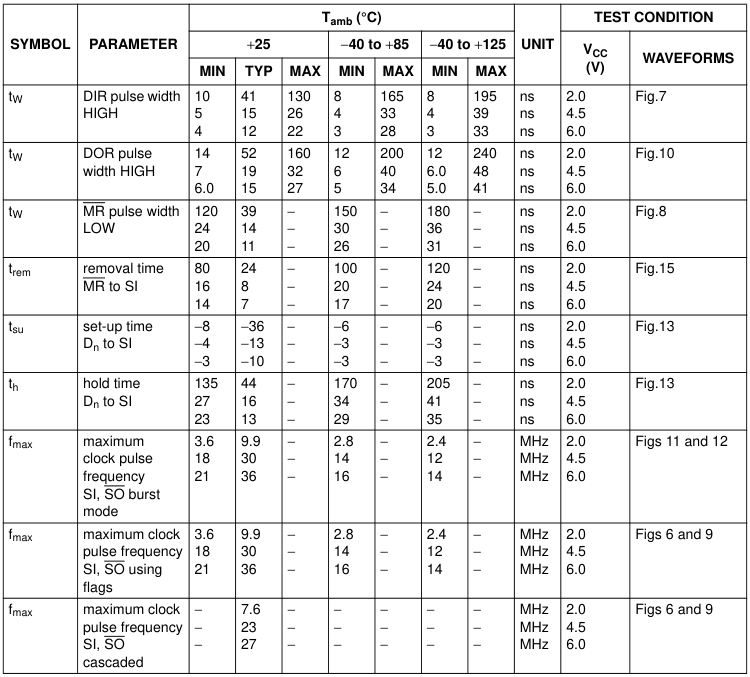
| SYMBOL | PARAMETER | T (°C) amb | UNIT | TEST CONDITION | |||||||
|---|---|---|---|---|---|---|---|---|---|---|---|
| −25 | −40 to +85 | −40 to +125 | V CC (V) | WAVEFORMS | |||||||
| MIN | TYP | MAX | MIN | MAX | MIN | MAX | |||||
| t W | DOR pulse width HIGH | 7 | 21 | 36 | 6.0 | 45 | 6.0 | 54 | ns | 4.5 | Fig.10 |
| t W | MR pulse width LOW | 26 | 15 | − | 33 | − | 39 | − | ns | 4.5 | Fig.8 |
| t rem | removal time MR to SI | 18 | 10 | − | 23 | − | 27 | − | ns | 4.5 | Fig.15 |
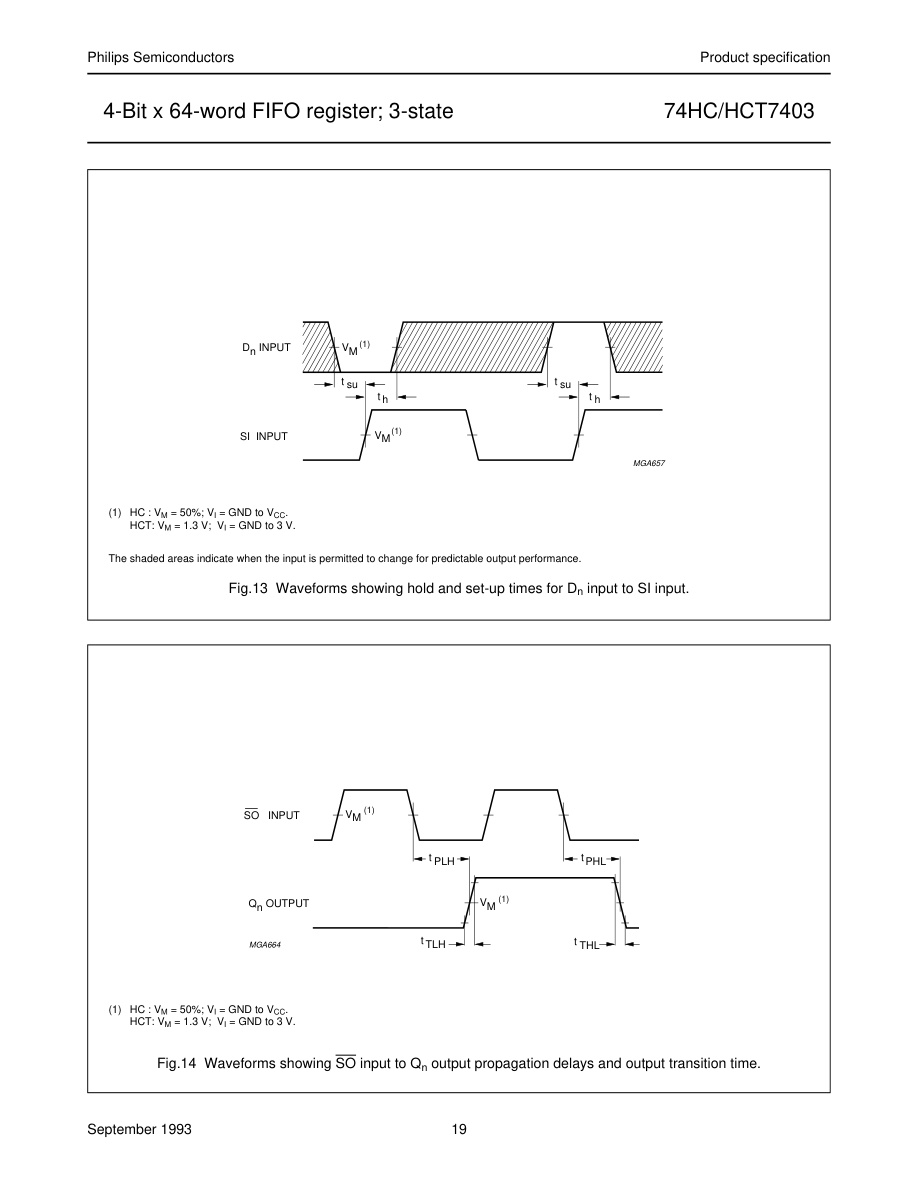
| t su | set-up time D to SI n | −5 | −16 | − | −4 | − | −4 | − | ns | 4.5 | Fig.13 |
| t h | hold time D to SI n | 30 | 18 | − | 38 | − | 45 | − | ns | 4.5 | Fig.13 |
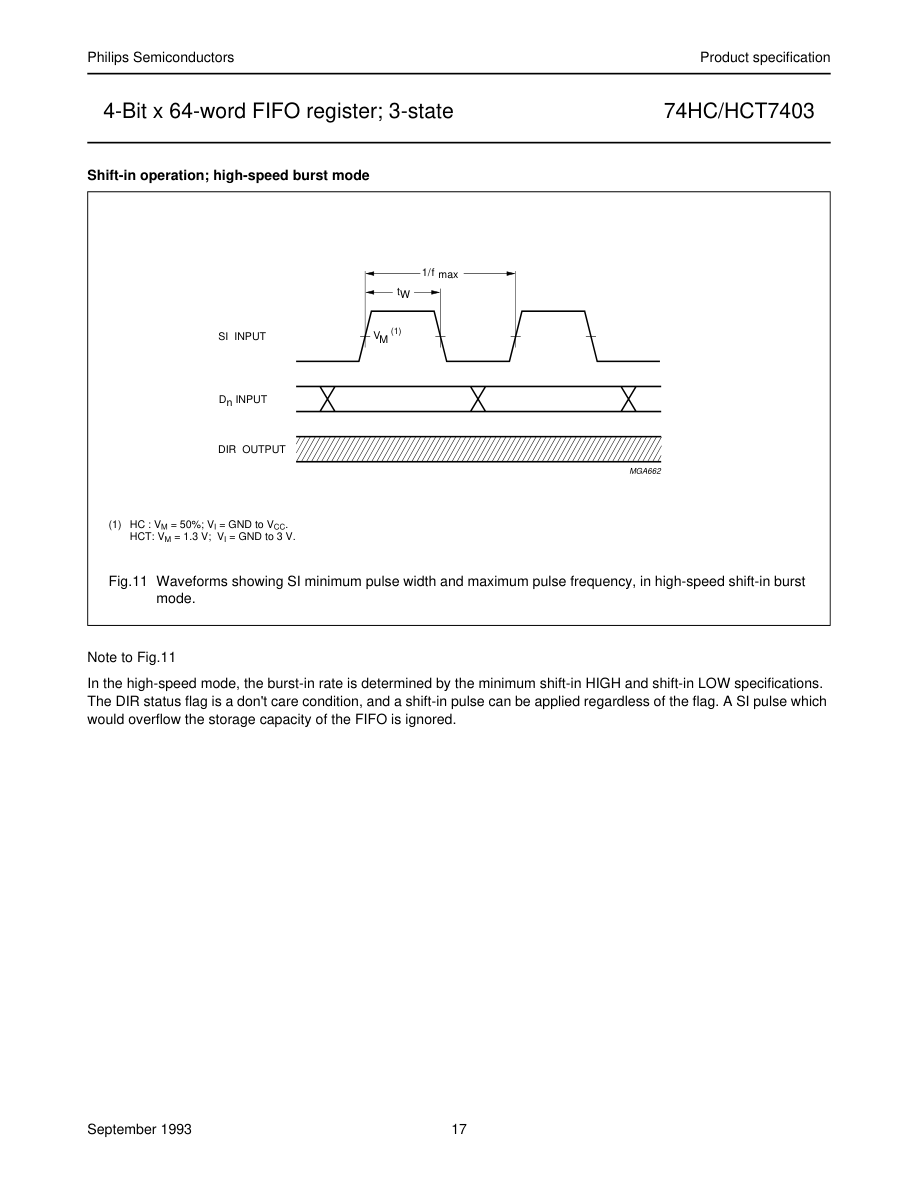
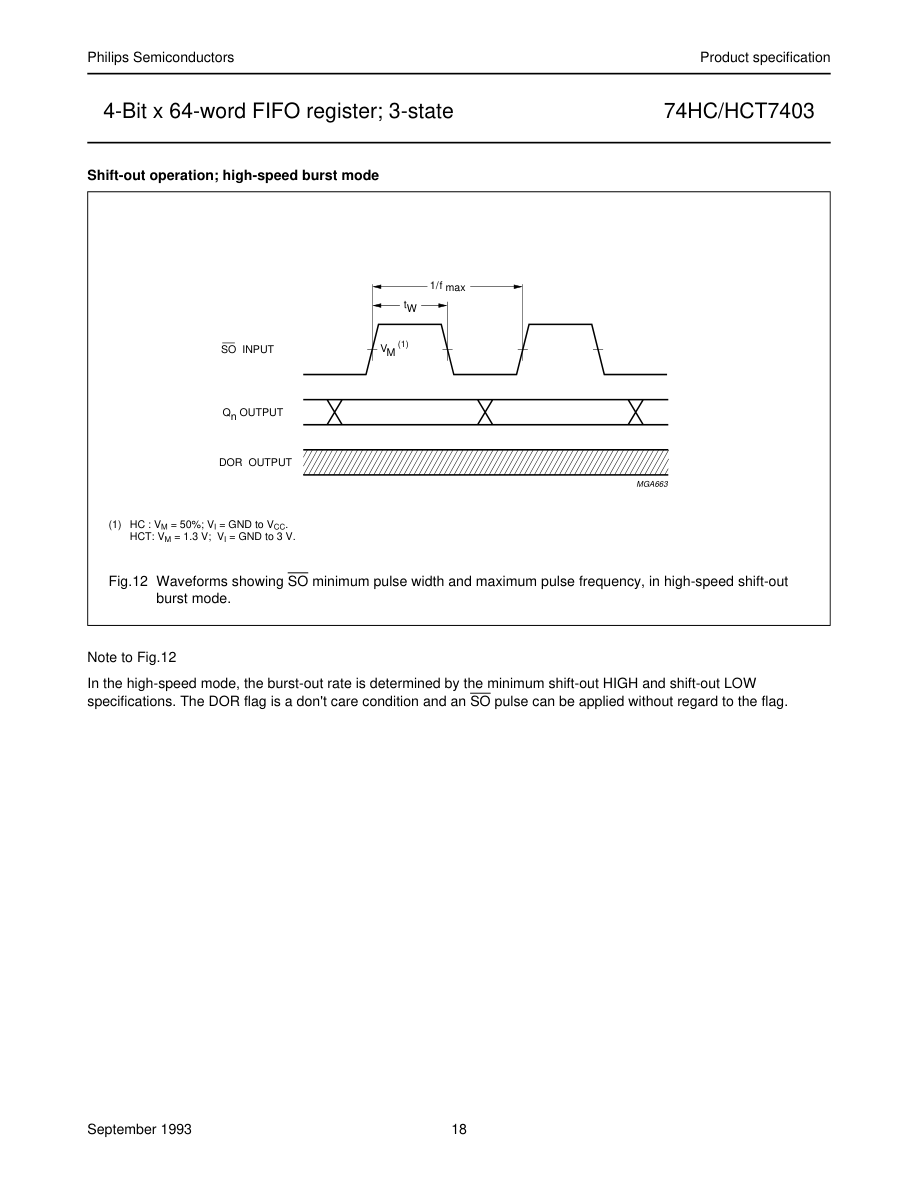
| f max | maximum clock pulse frequency SI, SO burst mode | 18 | 30 | − | 14 | − | 12 | − | MHz | 4.5 | Figs 11 and 12 |
| f max | maximum clock pulse frequency SI, SO using flags | 18 | 30 | − | 14 | − | 12 | − | MHz | 4.5 | Figs 6 and 9 |
| f max | maximum clock pulse frequency SI, SO cascaded | − | 23 | − | − | − | − | − | MHz | 4.5 | Figs 6 and 9 |
Page 12
Page 13
With FIFO full; SI held HIGH in anticipation of empty location
handbook, full pagewidth
(1) 2 VM
SO INPUT
(1) 1
SI INPUT
VM
5
tPLH
tW
bubble - up delay
(1)
DIR OUTPUT
VM 3
4 MGA660
(1) HC : VM = 50%; VI = GND to VCC. HCT: VM = 1.3 V; VI = GND to 3 V.
Fig.7 Waveforms showing bubble-up delay, SO input to DIR output and DIR output pulse width.
Notes to Fig.7 1. FIFO is initially full, shift-in is held HIGH 2. SO pulse; data in the output stage is unloaded, “bubble-up” process of empty location begins 3. DIR HIGH; when empty location reaches input stage, flag indicates FIFO is prepared for data input 4. DIR returns to LOW; data shift-in to empty location is complete, FIFO is full again 5. SI set LOW; necessary to complete shift-in process, DIR remains LOW, because FIFO is full.
Page 14
Page 15
1st SO pulse
2nd SO pulse
64th SO pulse
handbook, full pagewidth
1/f max
(1)
(1)
VM
VM
2
SO INPUT
4
6
t W
t PHL
t PLH
1
5 (1)
DOR OUTPUT
VM 3
7
Qn OUTPUT
1st word
2nd word
64th word
MGA661
(1) HC : VM = 50%; VI = GND to VCC. HCT: VM = 1.3 V; VI = GND to 3 V.
Fig.9 Waveforms showing the SO input to DOR output propagation delay. The SO pulse widths and maximum pulse frequency.
Notes to Fig.9 1. DOR HIGH; no data transfer in progress, valid data is present at output stage 2. SO set HIGH; results in DOR going LOW 3. DOR goes LOW; output stage “busy” 4. SO set LOW; data in the input stage is unloaded, and new data replaces it as empty location “bubbles-up” to input stage 5. DOR goes HIGH; transfer process completed, valid data present at output after the specified propagation delay 6. Repeat process to unload the 3rd through to the 64th word from FIFO 7. DOR remains LOW; FIFO is empty.
Page 16
With FIFO empty; SO is held HIGH in anticipation
handbook, full pagewidth
(1) 2
SI INPUT
VM
(1) 1
6
SO INPUT
VM
t PLH tW
ripple through delay
(1) 3
5
DOR OUTPUT
VM
tPHL tPLH
4
Q OUTPUT n
MGA658
(1) HC : VM = 50%; VI = GND to VCC. HCT: VM = 1.3 V; VI = GND to 3 V.
Fig.10 Waveforms showing ripple through delay SI input to DOR output, DOR output pulse width and propagation delay from the DOR pulse to the Qn output.
Notes to Fig.10 1. FIFO is initially empty, SO is held HIGH 2. SI pulse; loads data into FIFO and initiates ripple through process 3. DOR flag signals the arrival of valid data at the output stage 4. Output transition; data arrives at output stage after the specified propagation delay between the rising edge of the DOR pulse to the Qn output 5. DOR goes LOW; data shift-out is complete, FIFO is empty again 6. SO set LOW; necessary to complete shift-out process. DOR remains LOW, because FIFO is empty.
Page 17
Page 18
Page 19
Page 20
Page 21
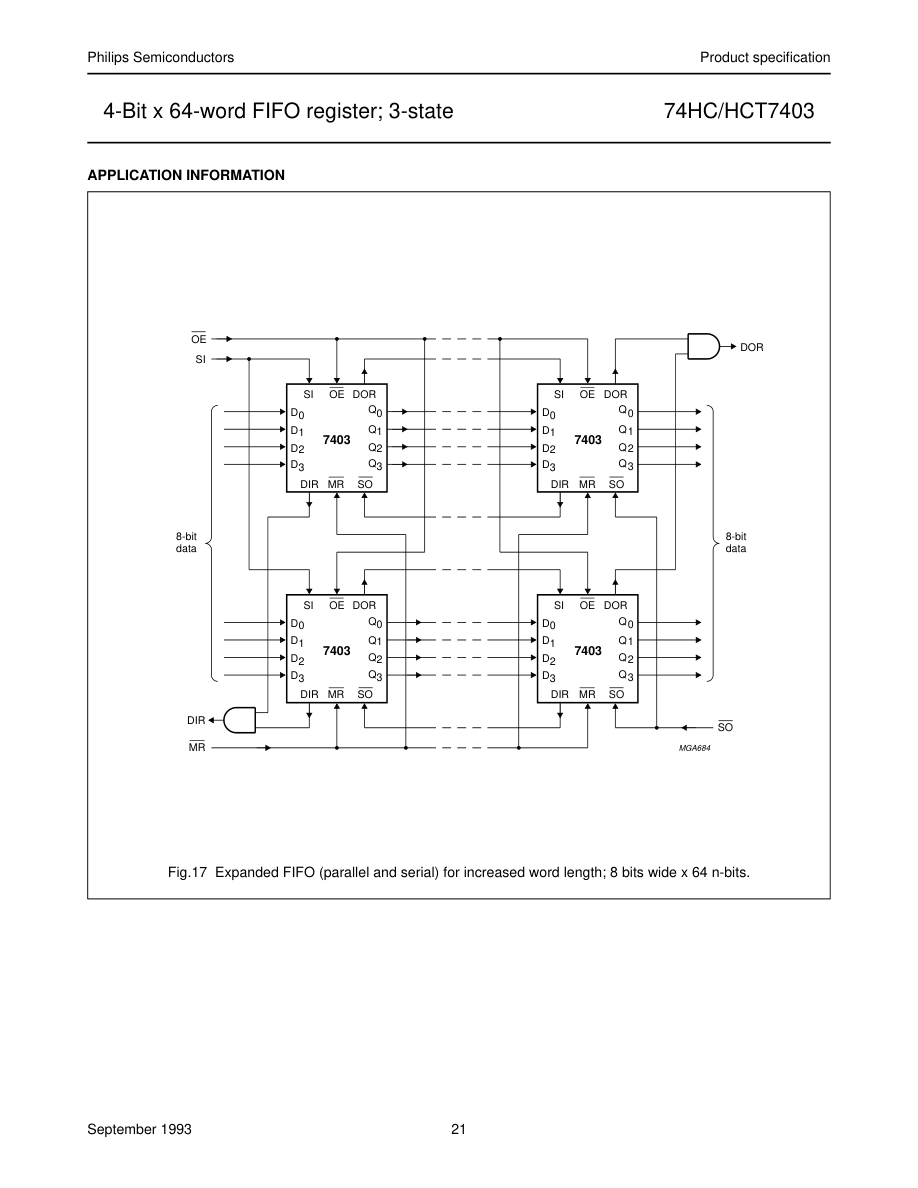
Page 22
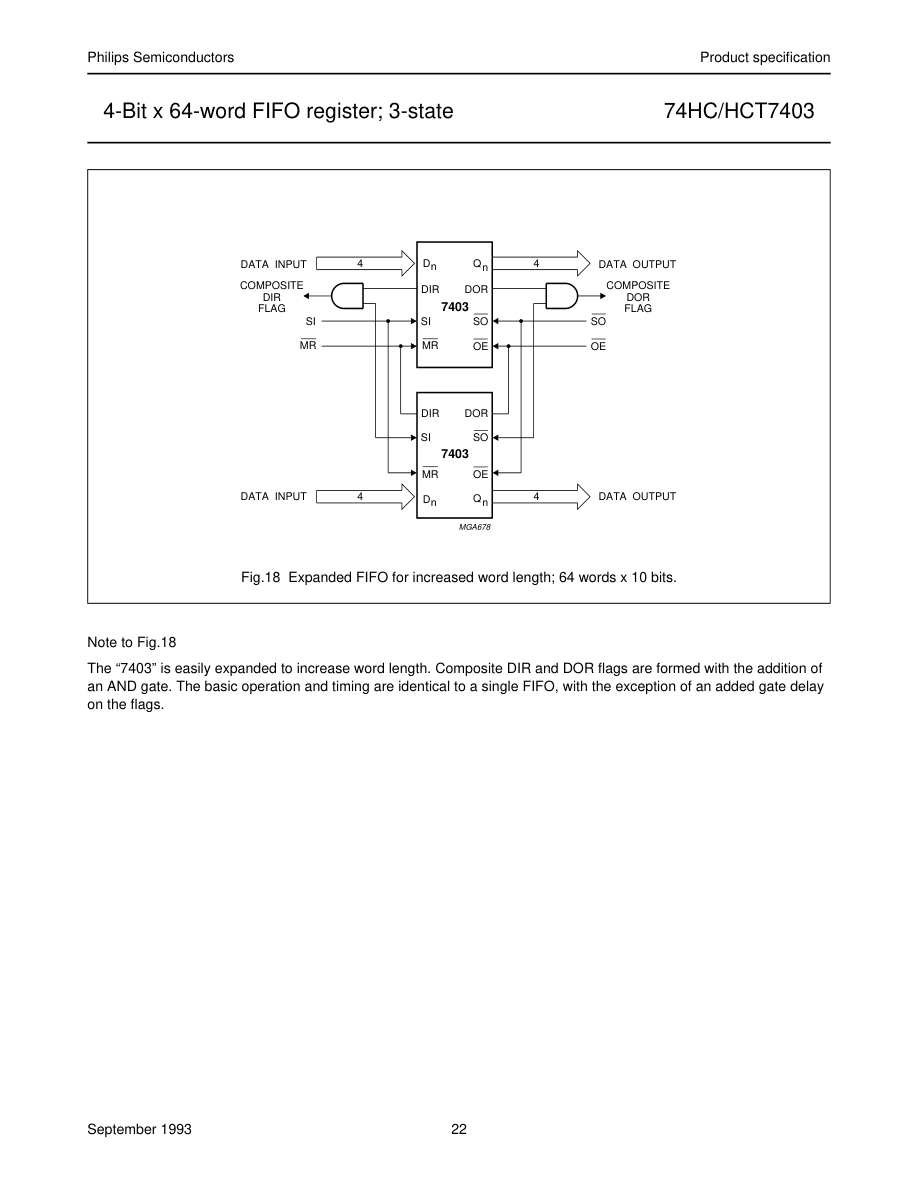
Page 23
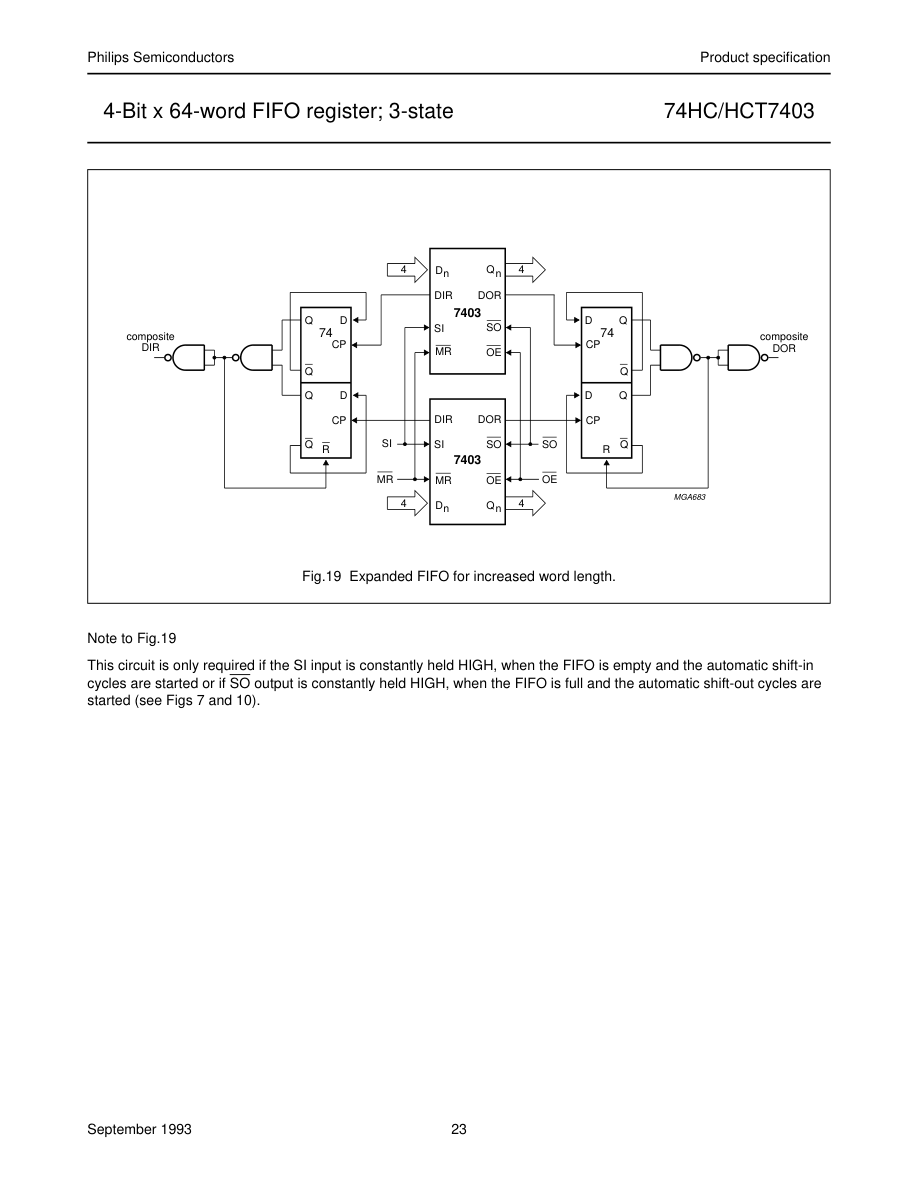
Page 24
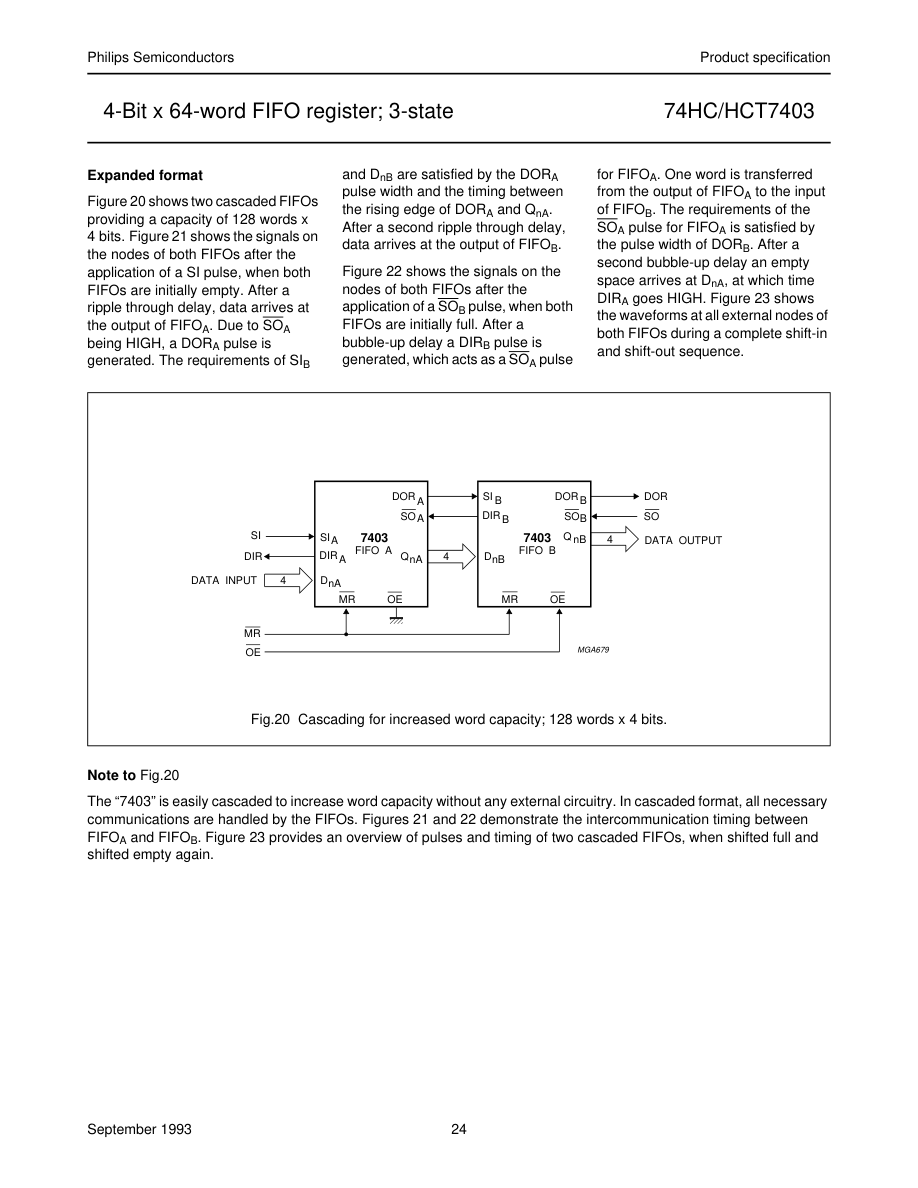
Page 25
handbook, full pagewidth
(1)
DIR A
VM
(1) 2
VM
SIA
ripple through delay
4 (1)
DORA SI B
VM
(1)
DIR B SOA 1
5 VM
6
Q nA nB D
3
ripple through delay
DORB
7 (1) VM
Q nB
MGA666
Fig.21 FIFO to FIFO communication; input timing under empty condition.
Notes to Fig.21 1. FIFOA and FIFOB initially empty, SOA held HIGH in anticipation of data 2. Load one word into FIFOA; SI pulse applied, results in DIR pulse 3. Data-out A/data-in B transition; valid data arrives at FIFOA output stage after a specified delay of the DOR flag, meeting data input set-up requirements of FIFOB 4. DORA and SIB pulse HIGH; (ripple through delay after SIA LOW) data is unloaded from FIFOA as a result of the data output ready pulse, data is shifted into FIFOB 5. DIRB and SOA go LOW; flag indicates input stage of FIFOB is busy, shift-out of FIFOA is complete 6. DIRB and SOA go HIGH automatically; the input stage of FIFOB is again able to receive data, SO is held HIGH in
anticipation of additional data 7. DORB goes HIGH; (ripple through delay after SIB LOW) valid data is present one propagation delay later at the FIFOB output stage.
Page 26
handbook, full pagewidth
(1)
DORB
VM
(1) 2
SO B
VM
bubble - up delay
3 (1)
DIR B SOA
VM
(1)
DORA SI B 1
5
4 VM
Q nA nB D
bubble - up delay
6
DIR A
(1) VM
MGA667
Fig.22 FIFO to FIFO communication; output timing under full condition.
Notes to Fig.22 1. FIFOA and FIFOB initially full, SIB held HIGH in anticipation of shifting in new data as an empty location bubbles-up 2. Unload one word from FIFOB; SO pulse applied, results in DOR pulse 3. DIRB and SOA pulse HIGH; (bubble-up delay after SOB LOW) data is loaded into FIFOB as a result of the DIR pulse, data is shifted out of FIFOA 4. DORA and SIB go LOW; flag indicates the output stage of FIFOA is busy, shift-in to FIFOB is complete 5. DORA and SIB go HIGH; flag indicates valid data is again available at FIFOA output stage, SIB is held HIGH, awaiting bubble-up of empty location 6. DIRA goes HIGH; (bubble-up delay after SOA LOW) an empty location is present at input stage of FIFOA.
Page 27
handbook, full pagewidth
sequence 1
sequence 2
sequence 3
sequence 4
sequence 5
sequence 6
(8)
SO INPUT B
(3) (4)
(14)
DORB OUTPUT
Q OUTPUT nB
(13)
(5)
DIRB OUTPUT
(9)
(12)
(2)
(6)
DORA OUTPUT
QnA OUTPUT
(10) (7)
DIRA OUTPUT
(11)
(1)
SI INPUT A
D INPUT nA
MR INPUT
MGA687
Fig.23 Waveforms showing the functionality and intercommunication between two FIFOs (refer to Fig.18).
Note to Fig.23
Sequence 1 (both FIFOS empty, starting SHIFT-IN process)
After a MR pulse has been applied FIFOA and FIFOB are empty. The DOR flags of FIFOA and FIFOB go LOW due to no
valid data being present at the outputs. The DIR flags are set HIGH due to the FIFOs being ready to accept data. SOB
is held HIGH and two SIA pulses are applied (1). These pulses allow two data words to ripple through to the output stage
of FIFOA and to the input stage of FIFOB (2). When data arrives at the output of FIFOB, a DORB pulse is generated (3).
When SOB goes LOW, the first bit is shifted out and a second bit ripples through to the output after which DORB goes
HIGH (4).
Page 28
Sequence 2 (FIFOB runs full) After the MR pulse, a series of 64 SI pulses are applied. When 64 words are shifted in, DIRB remains LOW due to FIFOB being full (5). DORA goes LOW due to FIFOA being empty.
Sequence 3 (FIFOA runs full) When 65 words are shifted in, DORA remains HIGH due to valid data remaining at the output of FIFOA. QnA remains HIGH, being the polarity of the 65th data word (6). After the 128th SI pulse, DIR remains LOW and both FIFOs are full (7). Additional pulses have no effect.
Sequence 4 (both FIFOs full, starting SHIFT-OUT process) SIA is held HIGH and two SOB pulses are applied (8). These pulses shift out two words and thus allow two empty locations to bubble-up to the input stage of FIFOB, and proceed to FIFOA (9). When the first empty location arrives at the input of FIFOA, a DIRA pulse is generated (10) and a new word is shifted into FIFOA. SIA is made LOW and now the second empty location reaches the input stage of FIFOA, after which DIRA remains HIGH (11).
Sequence 5 (FIFOA runs empty) At the start of sequence 5 FIFOA contains 63 valid words due to two words being shifted out and one word being shifted in, in sequence 4. An additional series of SOB pulses are applied. After 63 SOB pulses, all words from FIFOA are shifted into FIFOB. DORA remains LOW (12).
Sequence 6 (FIFOB runs empty) After the next SOB pulse, DIRB remains HIGH due to the input stage of FIFOB being empty. After another 63 SOB pulses, DORB remains LOW due to both FIFOs being empty (14). Additional SOB pulses have no effect. The last word remains available at the output Qn.
PACKAGE OUTLINES
See “74HC/HCT/HCU/HCMOS Logic Package Outlines”.