


 Download PDF
74HC4510 PHILIPS
Document overview
- PDF pages: 12
Technical content
Page 1
Page 2
FEATURES
- Output capability: standard
- ICC category: MSI
GENERAL DESCRIPTION
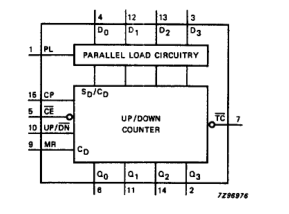
The 74HC/HCT4510 are high-speed Si-gate CMOS devices and are pin compatible with the “4510” of the “4000B” series. They are specified in compliance with JEDEC standard no. 7A. The 74HC/HCT4510 are edge-triggered synchronous up/down BCD counters with a clock input (CP), an up/down count control input (UP/DN), an active LOW count enable input (CE), an asynchronous active HIGH
parallel load input (PL), four parallel inputs (D0 to D3), four parallel outputs (Q0 to Q3), an active LOW terminal count output (TC), and an overriding asynchronous master reset input (MR). Information on D0 to D3 is loaded into the counter while PL is HIGH, independent of all other input conditions except the MR input, which must be LOW. With PL LOW, the counter changes on the LOW-to-HIGH transition of CP if CE is LOW. UP/DN determines the direction of the count, HIGH for counting up, LOW for counting down. When counting up, TC is LOW when Q0 and Q3 are HIGH and CE is LOW. When counting down, TC is LOW when Q0 to Q3 and CE are LOW. A HIGH on MR resets the counter (Q0 to
Q3 = LOW) independent of all other input conditions.
TC = CE . {(UP/DN) . Q0 . Q3+(UP/DN) . Q0 . Q1 . Q2 . Q3}
Logic equation for terminal count:
QUICK REFERENCE DATA
GND = 0 V; Tamb = 25 °C; tr = tf = 6 ns
| SYMBOL | PARAMETER | CONDITIONS | TYPICAL | UNIT | |
|---|---|---|---|---|---|
| HC | HCT | ||||
| t / t PHL PLH | propagation delay CP to Q n | C = 15 pF; V = 5 V L CC | 21 | 23 | ns |
| f max | maximum clock frequency | 57 | 58 | MHz | |
| C I | input capacitance | 3.5 | 3.5 | pF | |
| C PD | power dissipation capacitance per package | notes 1 and 2 | 50 | 53 | pF |
Notes 1. CPD is used to determine the dynamic power dissipation (PD in µW): PD = CPD × VCC2 × fi + ∑ (CL × VCC2 × fo) where: fi = input frequency in MHz fo = output frequency in MHz ∑ (CL × VCC2 × fo) = sum of outputs CL = output load capacitance in pF VCC = supply voltage in V 2. For HC the condition is VI = GND to VCC. For HCT the condition is VI = GND to VCC − 1.5 V
ORDERING INFORMATION
See “74HC/HCT/HCU/HCMOS Logic Package Information”.
Page 3
PIN DESCRIPTION
| PIN NO. | SYMBOL | NAME AND FUNCTION |
|---|---|---|
| 1 4, 12, 13, 3 5 6, 11, 14, 2 7 8 9 10 15 16 | PL D to D 0 3 CE Q to Q 0 3 TC GND MR UP/DN CP V CC | parallel load input (active HIGH) parallel inputs count enable input (active LOW) parallel outputs terminal count output (active LOW) ground (0 V) asynchronous master reset input (active HIGH) up/down control input clock input (LOW-to-HIGH, edge-triggered) positive supply voltage |
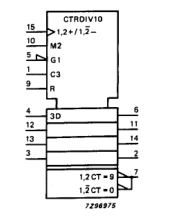
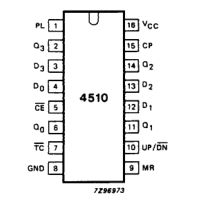
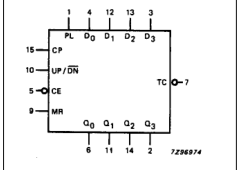
Fig.2 Logic symbol.
Fig.1 Pin configuration.
Fig.3 IEC logic symbol.
Page 4
FUNCTION TABLE
| Column 1 | Column 2 | Column 3 | Column 4 | Column 5 | Column 6 |
|---|---|---|---|---|---|
| MR | PL | UP/DN | CE | CP | MODE |
| L L L L H | H L L L X | X X L H X | X H L L X | X X ↑ ↑ X | parallel load no change count down count up reset |
Notes 1. H = HIGH voltage level L = LOW voltage level X = don’t care ↑ = LOW-to-HIGH clock transition
Fig.4 Functional diagram.
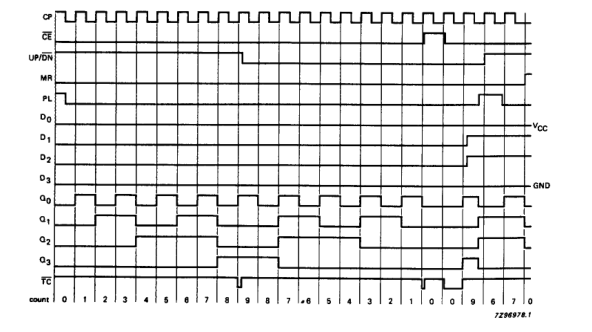
Fig.5 Timing diagram.
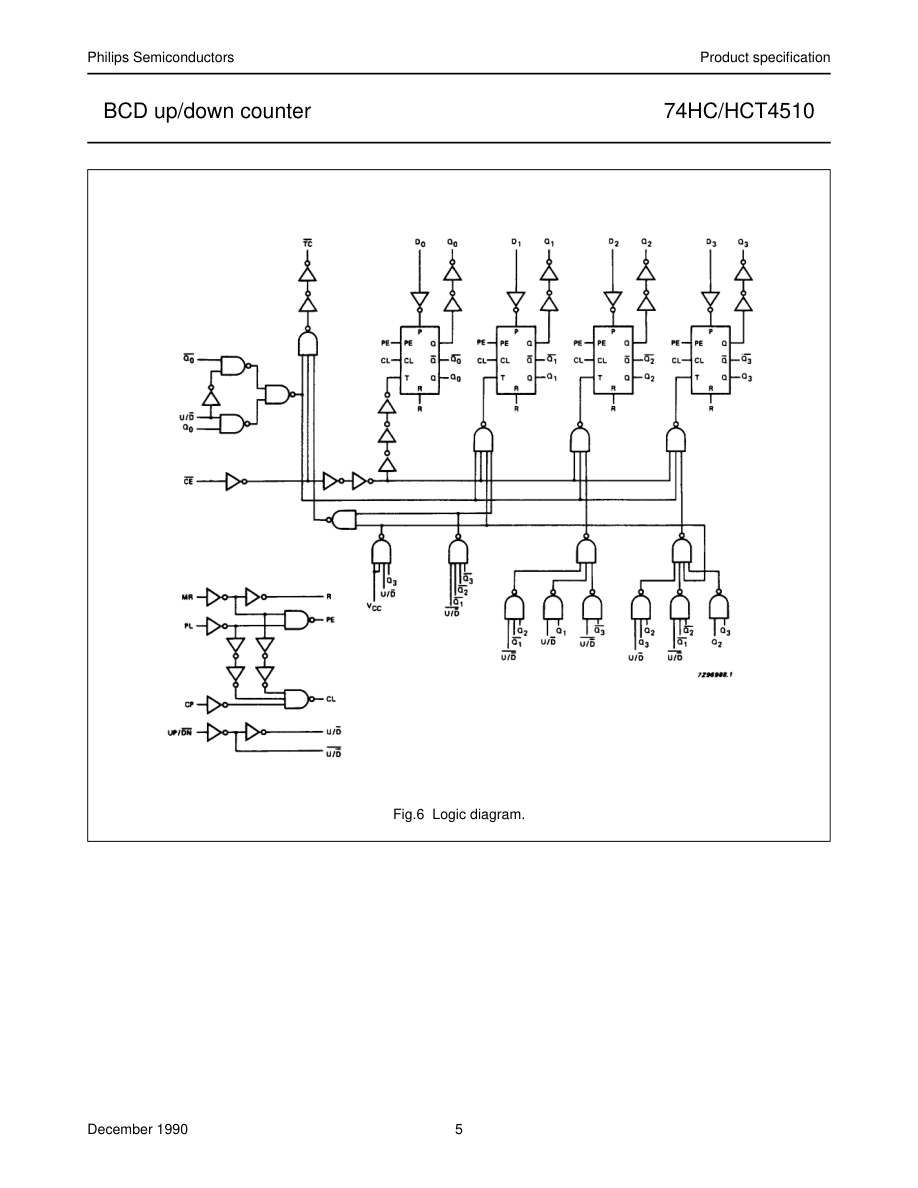
Page 5
Page 6
DC CHARACTERISTICS FOR 74HC
For the DC characteristics see “74HC/HCT/HCU/HCMOS Logic Family Specifications”. Output capability: standard ICC category: MSI
AC CHARACTERISTICS FOR 74HC
GND = 0 V; tr = tf = 6 ns; CL = 50 pF
| SYMBOL | PARAMETER | T (°C) amb | UNIT | TEST CONDITIONS | |||||||
|---|---|---|---|---|---|---|---|---|---|---|---|
| 74HC | V CC (V) | WAVEFORMS | |||||||||
| +25 | −40 to +85 | −40 to +125 | |||||||||
| min. | typ. | max. | min. | max. | min. | max. | |||||
| t / t PHL PLH | propagation delay CP to Q n | 69 25 20 | 220 44 37 | 275 55 47 | 330 66 56 | ns | 2.0 4.5 6.0 | Fig.7 | |||
| t PHL | propagation delay MR to Q n | 63 23 18 | 210 42 36 | 265 53 45 | 315 63 54 | ns | 2.0 4.5 6.0 | Fig.10 | |||
| t / t PLH PHL | propagation delay PL to Q n | 77 28 22 | 250 50 43 | 315 63 54 | 375 75 64 | ns | 2.0 4.5 6.0 | Fig.9 | |||
| t / t PHL PLH | propagation delay CP to TC | 74 27 22 | 260 52 44 | 325 65 55 | 395 78 66 | ns | 2.0 4.5 6.0 | Fig.7 | |||
| t / t PHL PLH | propagation delay CE to TC | 36 13 10 | 125 25 21 | 155 31 26 | 190 38 32 | ns | 2.0 4.5 6.0 | Fig.8 | |||
| t PLH | propagation delay MR to TC | 69 25 20 | 235 47 40 | 295 59 50 | 355 71 60 | ns | 2.0 4.5 6.0 | Fig.10 | |||
| t / t PHL PLH | propagation delay PL to TC | 91 33 26 | 300 60 51 | 375 75 64 | 450 90 77 | ns | 2.0 4.5 6.0 | Fig.9 | |||
| t / t THL TLH | output transition time | 19 7 6 | 75 15 13 | 95 19 16 | 110 22 19 | ns | 2.0 4.5 6.0 | Fig.9 | |||
| t W | pulse width CP, CE HIGH or LOW | 80 16 14 | 25 9 7 | 100 20 17 | 120 24 20 | ns | 2.0 4.5 6.0 | Fig.7 | |||
| t W | parallel load pulse width HIGH | 80 16 14 | 22 8 7 | 100 20 17 | 120 24 20 | ns | 2.0 4.5 6.0 | Fig.10 | |||
| t W | master reset pulse width HIGH | 100 20 17 | 19 7 6 | 125 25 21 | 150 30 26 | ns | 2.0 4.5 6.0 | Fig.10 |
Page 7
| SYMBOL | PARAMETER | T (°C) amb | UNIT | TEST CONDITIONS | |||||||
|---|---|---|---|---|---|---|---|---|---|---|---|
| 74HC | V CC (V) | WAVEFORMS | |||||||||
| +25 | −40 to +85 | −40 to +125 | |||||||||
| min. | typ. | max. | min. | max. | min. | max. | |||||
| t rem | removal time MR to CP | 80 16 14 | 28 10 8 | 100 20 17 | 120 24 20 | ns | 2.0 4.5 6.0 | Fig.10 | |||
| t rem | removal time PL to CP | 80 16 14 | 14 5 4 | 100 20 17 | 120 24 20 | ns | 2.0 4.5 6.0 | Fig.10 | |||
| t su | set-up time UP/DN to CP | 100 20 17 | 30 11 9 | 125 25 21 | 150 30 26 | ns | 2.0 4.5 6.0 | Fig.8 | |||
| t su | set-up time CE to CP | 100 20 17 | 19 7 6 | 125 25 21 | 150 30 26 | ns | 2.0 4.5 6.0 | Fig.8 | |||
| t su | set-up time D to PL n | 100 20 17 | 17 6 5 | 125 25 21 | 150 30 26 | ns | 2.0 4.5 6.0 | Fig.11 | |||
| t h | hold time CE to CP | 5 5 5 | 0 0 0 | 5 5 5 | 5 5 5 | ns | 2.0 4.5 6.0 | Fig.8 | |||
| t h | hold time D to PL n | 3 3 3 | −6 −2 −2 | 3 3 3 | 3 3 3 | ns | 2.0 4.5 6.0 | Fig.11 | |||
| t h | hold time UP/DN to CP | 0 0 0 | −19 −7 −6 | 0 0 0 | 0 0 0 | ns | 2.0 4.5 6.0 | Fig.8 | |||
| f max | maximum clock pulse frequency | 6.0 30 35 | 17 52 62 | 4.8 24 28 | 4.0 20 24 | MHz | 2.0 4.5 6.0 | Fig.7 |
Page 8
DC CHARACTERISTICS FOR 74HCT
For the DC characteristics see “74HC/HCT/HCU/HCMOS Logic Family Specifications”. Output capability: standard ICC category: MSI
Note to HCT types The value of additional quiescent supply current (∆ICC) for a unit load of 1 is given in the family specifications. To determine ∆ICC per input, multiply this value by the unit load coefficient shown in the table below
| INPUT | UNIT LOAD COEFFICIENT |
|---|---|
| D n PL, CE UP/DN CP MR | 0.75 1.00 1.00 1.25 1.50 |
AC CHARACTERISTICS FOR 74HCT
GND = 0 V; tr = tf = 6 ns; CL = 50 pF
| SYMBOL | PARAMETER | T (°C) amb | UNIT | TEST CONDITIONS | |||||||
|---|---|---|---|---|---|---|---|---|---|---|---|
| 74HCT | V CC (V) | WAVEFORMS | |||||||||
| +25 | −40 to +85 | −40 to +125 | |||||||||
| min. | typ. | max. | min. | max. | min. | max. | |||||
| t / t PHL PLH | propagation delay CP to Q n | 27 | 50 | 63 | 75 | ns | 4.5 | Fig.7 | |||
| t PHL | propagation delay MR to Q n | 25 | 42 | 53 | 63 | ns | 4.5 | Fig.10 | |||
| t / t PLH PHL | propagation delay PL to Q n | 28 | 53 | 66 | 80 | ns | 4.5 | Fig.9 | |||
| t / t PHL PLH | propagation delay CP to TC | 29 | 58 | 73 | 87 | ns | 4.5 | Fig.7 | |||
| t / t PHL PLH | propagation delay CE to TC | 17 | 31 | 39 | 47 | ns | 4.5 | Fig.8 | |||
| t PLH | propagation delay MR to TC | 31 | 50 | 63 | 75 | ns | 4.5 | Fig.10 | |||
| t / t PHL PLH | propagation delay PL to TC | 35 | 68 | 85 | 102 | ns | 4.5 | Fig.10 | |||
| t / t THL TLH | output transition time | 7 | 15 | 19 | 22 | ns | 4.5 | Fig.9 | |||
| t W | pulse width CP, CE HIGH or LOW | 16 | 9 | 20 | 24 | ns | 4.5 | Fig.7 | |||
| t W | parallel load pulse width HIGH | 16 | 6 | 20 | 24 | ns | 4.5 | Fig.10 | |||
| t W | master reset pulse width HIGH | 20 | 4 | 25 | 30 | ns | 4.5 | Fig.10 |
Page 9
| SYMBOL | PARAMETER | T (°C) amb | UNIT | TEST CONDITIONS | |||||||
|---|---|---|---|---|---|---|---|---|---|---|---|
| 74HCT | V CC (V) | WAVEFORMS | |||||||||
| +25 | −40 to +85 | −40 to +125 | |||||||||
| min. | typ. | max. | min. | max. | min. | max. | |||||
| t rem | removal time MR to CP | 23 | 13 | 29 | 35 | ns | 4.5 | Fig.10 | |||
| t rem | removal time PL to CP | 17 | 10 | 21 | 26 | ns | 4.5 | Fig.10 | |||
| t su | set-up time UP/DN to CP | 20 | 12 | 25 | 30 | ns | 4.5 | Fig.8 | |||
| t su | set-up time CE to CP | 20 | 6 | 25 | 30 | ns | 4.5 | Fig.8 | |||
| t su | set-up time D to PL n | 20 | 6 | 25 | 30 | ns | 4.5 | Fig.11 | |||
| t h | hold time CE to CP | 5 | 0 | 5 | 5 | ns | 4.5 | Fig.8 | |||
| t h | hold time D to PL n | 5 | 0 | 5 | 5 | ns | 4.5 | Fig.11 | |||
| t h | hold time UP/DN to CP | 0 | −5 | 0 | 0 | ns | 4.5 | Fig.8 | |||
| f max | maximum clock pulse frequency | 30 | 53 | 24 | 20 | MHz | 4.5 | Fig.7 |
AC WAVEFORMS
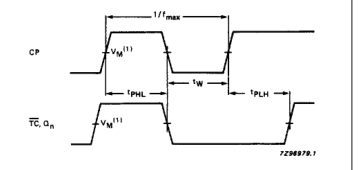
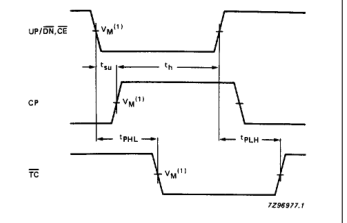
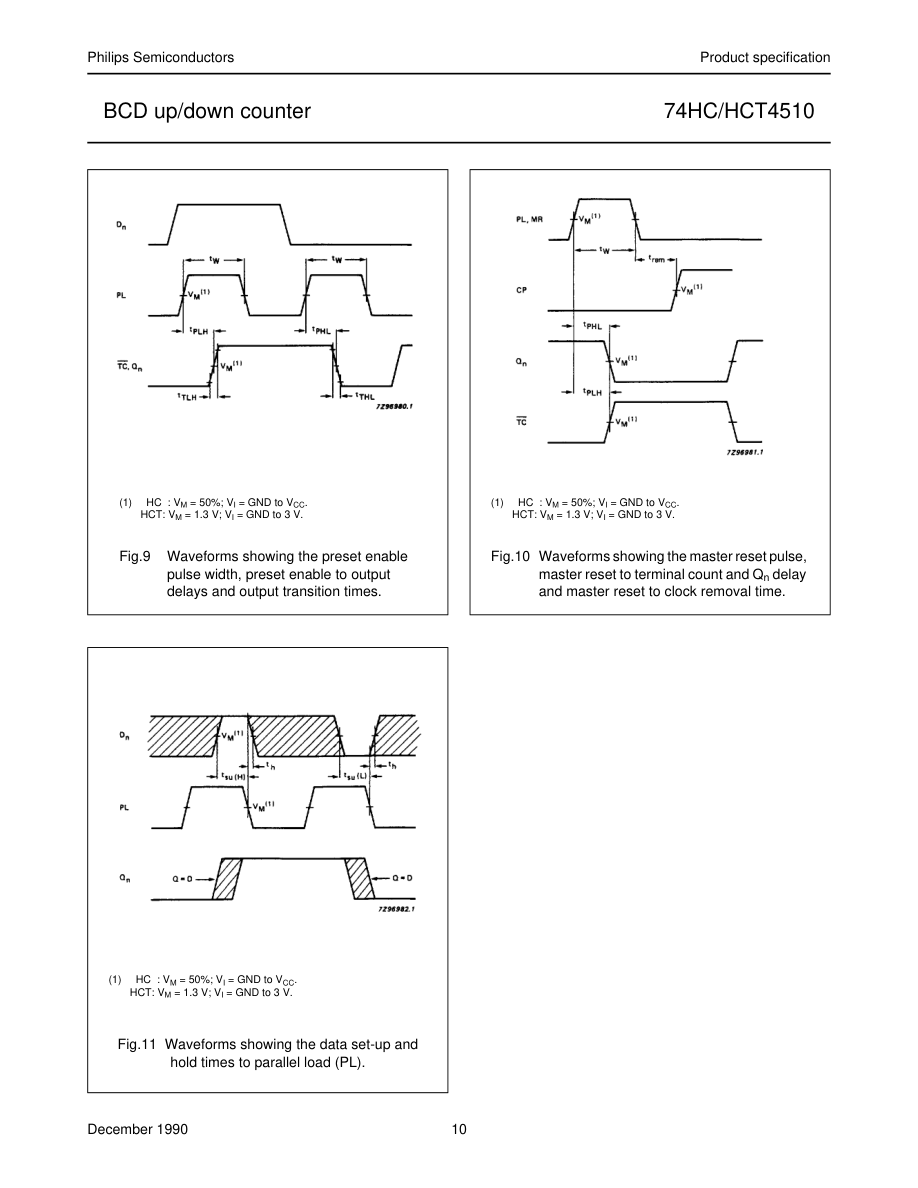
(1) HC : VM = 50%; VI = GND to VCC. HCT: VM = 1.3 V; VI = GND to 3 V.
Fig.7 Waveforms showing the clock (CP) to output (Qn) and terminal count (TC) propagation delays, the clock pulse width and the maximum clock pulse frequency.
(1) HC : VM = 50%; VI = GND to VCC. HCT: VM = 1.3 V; VI = GND to 3 V.
Fig.8 Waveforms showing the set-up and hold times from count enable (CE) and up/down (UP/DN) control inputs to the clock pulse (CP), the propagation delays from UP/DN, CE to TC.
Page 10
Page 11
APPLICATION INFORMATION
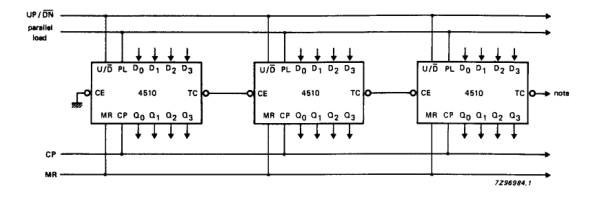
Terminal count (TC) lines at the 2nd, 3rd, etc. stages may have a negative-going glitch pulse resulting from differential delays of different 4510s. These negative-going glitches do not affect proper 4510 operation. However, if the terminal count signals are used to trigger other edge sensitive logic devices, such as flip-flops or counters, the terminal count signals should be gated with the clock signal using a 2-input OR gate such as HC/HCT32.
Fig.12 Cascading counter packages (parallel clocking).
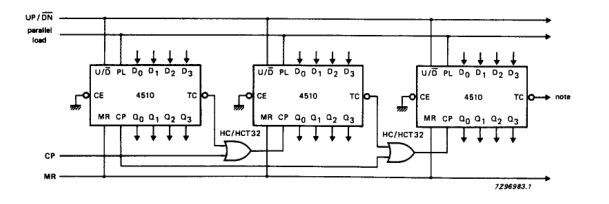
Ripple clocking mode: the UP/DN control can be changed at any count. The only restriction on changing the UP/DN control is that the clock input to the first counting stage must be “HIGH”. For cascading counters operating in a fixed up-count or down-count mode, the OR gates are not required between stages and TC is connected directly to the CP input of the next stage with CE grounded.
Fig.13 Cascading counter packages (ripple clocking).
Page 12
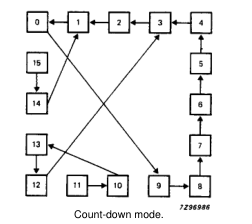
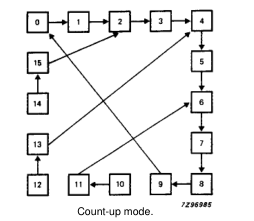
Count-up mode: illegal states in BCD counters corrected in one count. Count-down mode: illegal states in BCD counters corrected in one or two counts.
Fig.14 State diagram.
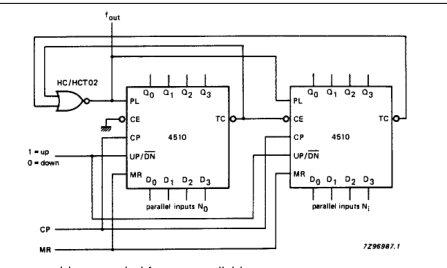
Use the following formulae to calculate Ntotal: i π Ntotal
N0 10 Ni = ( × ) + 1 fin fout = -------------- Ntotal Formulae are only applicable if legal data is provided to the parallel inputs.
Fig.15 Programmable cascaded frequency divider.
PACKAGE OUTLINES
| Column 1 | Column 2 | Column 3 | Column 4 | Column 5 | Column 6 |
|---|---|---|---|---|---|
| parallel inputs | count-up n | count-down n | |||
| D 3 | D 2 | D 1 | D 0 | ||
| 0 0 0 0 0 0 0 0 1 1 | 0 0 0 0 1 1 1 1 0 0 | 0 0 1 1 0 0 1 1 0 0 | 0 1 0 1 0 1 0 1 0 1 | 9 8 7 6 5 4 3 2 1 (1) | (1) 1 2 3 4 5 6 7 8 9 |