


 Download PDF
74HC03 SS
Document overview
- PDF pages: 5
Technical content
Page 1

Rev 1.0
Quad 2-Input Open Drain NAND Gate in bare die form
Description
The 74HC03 is fabricated using a 2.5µm 5V CMOS process and has the same high speed performance of LSTTL combined with CMOS low power consumption. This device is comprised of 3 stages including buffer output, which enables high noise immunity with stable output. With an external pull-up resistor the device can be used in wired AND configuration. This device can be also used as an LED driver and in any other application requiring a current sink. All inputs are protected from damage due to static discharge by internal diode clamps to VCC and Ground.
Ordering Information
The following part suffixes apply:
No suffix - MIL-STD-883 /2010B Visual Inspection
For High Reliability versions of this product please see
54HC03
Supply Formats:
Default – Die in Waffle Pack (400 per tray capacity)
Sawn Wafer on Tape – On request
Unsawn Wafer – On request
Die Thickness <> 350µm(14 Mils) – On request
Assembled into Ceramic Package – On request
Page 1 of 5
16/04/18
Features:
Output Drive Capability: 10 LSTTL Loads
Low Input Current: 1µA
Outputs directly interface CMOS, NMOS and TTL
Operating Voltage Range: 2V to 6V
CMOS High Noise Immunity
Function compatible with 74LS03.
Die Dimensions in µm (mils)
1200 (47)
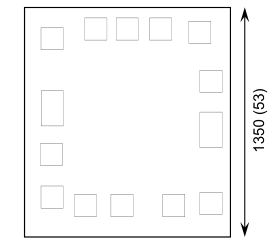
Mechanical Specification
| Die Size (Unsawn) | 1200 x 1350 47 x 53 | µm mils |
| Minimum Bond Pad Size | 106 x 106 4.17 x 4.17 | µm mils |
| Die Thickness | 350 (±20) 13.78 (±0.79) | µm mils |
| Top Metal Composition | Al 1%Si 1.1µm | |
| Back Metal Composition | N/A – Bare Si | |
Page 2

Rev 1.0
16/04/18
Pad Layout and Functions
| 12 11 10 9 13 8 14 7 DIE ID 1 2 3 4 5 6 | |
| 0,0 |
| PAD | FUNCTION | COORDINATES (mm) | |
| X | Y | ||
| 1 A1 0.131 0.460 | |||
| 2 | B1 | 0.131 | 0.153 |
| 3 | Y1 | 0.305 | 0.121 |
| 4 | A2 | 0.489 | 0.121 |
| 5 | B2 | 0.786 | 0.121 |
| 6 | Y2 | 0.970 | 0.131 |
| 7 | GND | 0.980 | 0.462 |
| 8 | Y3 | 0.980 | 0.764 |
| 9 | A3 | 0.950 | 1.115 |
| 10 | B3 | 0.713 | 1.125 |
| 11 | Y4 | 0.543 | 1.125 |
| 12 | A4 | 0.369 | 1.125 |
| 13 | B4 | 0.131 | 1.091 |
| 14 | V CC | 0.131 | 0.631 |
| CONNECT CHIP BACK TO V OR FLOAT CC | |||
1200µm (47.24 mils)
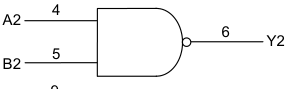
Logic Diagram
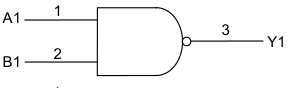
Truth Table
| INPUTS | OUTPUT | |
| A | B | Y |
| L L H H | L H L H | Z Z Z L |
| H = High level (steady state) L = Low level (steady state) Z = High Impedance state | ||
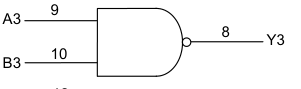
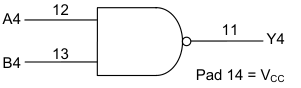
Pad 7 = GND
Page 2 of 5
Page 3

Rev 1.0
Absolute Maximum Ratings1
16/04/18
| PARAMETER | SYMBOL | VALUE | UNIT |
|---|---|---|---|
| DC Supply Voltage (Referenced to GND) | V CC | -0.5 to +7.0 | V |
| DC Input V oltage (Referenced to GND) | V IN | -1.5 to V +1.5 CC | V |
| DC Output Voltage (Referenced to GND) | V OUT | -0.5 to V +0.5 CC | V |
| DC Input C urrent, per pin | I IN | ±20 | mA |
| DC Output Current, per pin | I OUT | ±25 | mA |
| DC V or GND Current, per pin CC | I CC | ±50 | mA |
| Power Dissipation in Still Air2 | P D | 750 | mW |
| Storage Temperature Range | T STG | -65 to 150 | °C |
- Operation above the absolute maximum rating may cause device failure. Operation at the absolute maximum ratings, for extended periods, may reduce device reliability. 2. Measured in plastic DIP package, results in die form are dependent on die attach and assembly method.
Recommended Operating Conditions3 (Voltages referenced to GND)
| PARAMETER | SYMBOL | MIN | MAX | |
|---|---|---|---|---|
| DC Supply Voltage | V CC | 2 | 6 | |
| DC Input or Output Voltage | V ,V IN OUT | 0 | V CC | |
| Operating Temperature Range | T J | 0 | +85 | |
| Input Rise and Fall Time | V = 2.0V CC | t, t r f | 0 | 1000 |
| V = 4.5V CC | 0 | 500 | ||
| V = 6.0V CC | 0 | 400 | ||
UNITS
V V °C
ns
- This device contains protection circuitry to guard against damage due to high static voltages or electric fields. However, precautions must be taken to avoid applications of any voltage higher than maximum rated voltages to this high-impedance circuit. For proper operation, VIN and VOUT should be constrained to the range GND ≤ (VIN or VOUT) ≤ VCC. Unused inputs must always be tied to an appropriate logic voltage level (e.g., either GND or VCC). Unused outputs must be left open.
DC Electrical Characteristics (Voltages Referenced to GND)
| PARAMETER | SYMBOL | V CC | CONDITIONS | LIMITS | UNITS | ||
|---|---|---|---|---|---|---|---|
| 25°C | 85°C | FULL RANGE4 | |||||
| Minimum Hig h-Level Input Voltage | V IH | 2.0V | V = 0.1V or OUT V -0.1V CC │I │≤ 20µA OUT | 1.5 | 1.5 | 1.5 | V |
| 4.5V | 3.15 | 3.15 | 3.15 | ||||
| 6.0V | 4.2 | 4.2 | 4.2 | ||||
| Maximum Low-Level Input Voltage | V IL | 2.0V | V = 0.1V or OUT V -0.1V CC │I │≤ 20µA OUT | 0.5 | 0.5 | 0.5 | V |
| 4.5V | 1.35 | 1.35 | 1.35 | ||||
| 6.0V | 1.8 | 1.8 | 1.8 | ||||
- 0˚C ≤ TJ ≤ +85˚C
Page 3 of 5
Page 4

Rev 1.0
16/04/18
DC Electrical Characteristics (Voltages Referenced to GND)
| PARAMETER | SYMBOL | V CC | CONDITIONS | LIMITS | UNITS | ||
|---|---|---|---|---|---|---|---|
| 25°C | 85°C | FULL RANGE4 | |||||
| Maximum Low-Level Output Voltage | V OL | 2.0V | V = V IN IH │I │≤ 20µA OUT | 0.1 | 0.1 | 0.1 | V |
| 4.5V | 0.1 | 0.1 | 0.1 | ||||
| 6.0V | 0.1 | 0.1 | 0.1 | ||||
| 4.5V | V = V IN IH │I │≤ 4.0mA OUT | 0.26 | 0.33 | 0.33 | |||
| 6.0V | V = V IN IH │I │≤ 5.2mA OUT | 0.26 | 0.33 | 0.33 | |||
| Maximu m Input Leakage Current | I IN | 6.0V | V = V or GND IN CC | ±0.1 | ±1.0 | ±1.0 | µA |
| Maximum 3-State leakage current | I OZ | 6.0V | V =V or GND OUT CC V = V or V IN IL IH | ±0.5 | ±5.0 | ±5.0 | µA |
| Maximum Quiescent Supply Leakage Cur rent | I CC | 6.0V | V = V or GND IN CC I = 0µA OUT | 1 | 10 | 10 | µA |
AC Electrical Characteristics5
| PARAMETER | SYMBOL | V CC | CONDITIONS | LIMITS | UNITS | ||
|---|---|---|---|---|---|---|---|
| 25°C | 85°C | FULL RANGE4 | |||||
| Maximum Propaga tion Delay, A or B to Y (Figu res 2,4) | t t PLZ, PZL | 2.0V | C = 50pF, L t = t = 6ns r f | 120 | 150 | 150 | ns |
| 4.5V | 24 | 30 | 30 | ||||
| 6.0V | 20 | 26 | 26 | ||||
| Maximum Output Tra nsition Time, any Output (Figures 2,4) | t THL | 2.0V | C = 50pF, L t = t = 6ns r f | 75 | 95 | 95 | ns |
| 4.5V | 15 | 19 | 19 | ||||
| 6.0V | 13 | 16 | 16 | ||||
| Maximum Input Cap acitance | C IN | - | - | 10 | 10 | 10 | pF |
| Maximum Three-State Output Capacitance (Output in High- Impedance State) | C OUT | - | - | 10 | 10 | 10 | pF |
| Power Dissipation Capacitance (Pe r Gate)6 | C PD | - | T = 25°C, A V = 5.0V CC | TYPICAL | pF | ||
| 8 | |||||||
- Not production tested in die form, characterized by chip design and tested in package LAT.
2f + ICC VCC.
- Used to determine the no-load dynamic power consumption: PD = CPD VCC
Page 4 of 5
Page 5

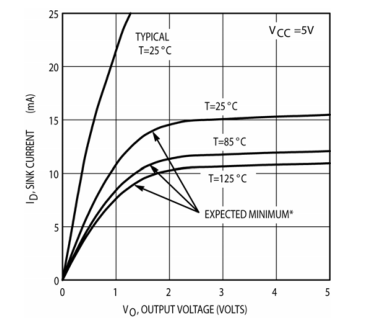
Figure 1 – Open-Drain Output Characteristics
VCC
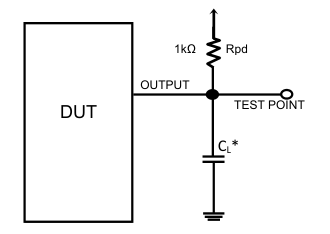
\* Includes all probe and jig capacitance
Figure 4 – Test Circuit
Rev 1.0
16/04/18
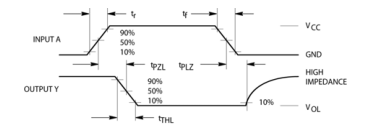
Figure 2 – Switching Waveforms
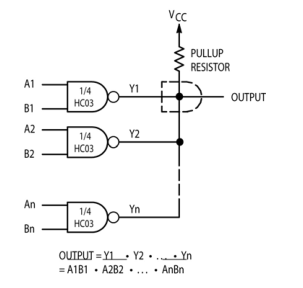
Figure 3 – Wired AND
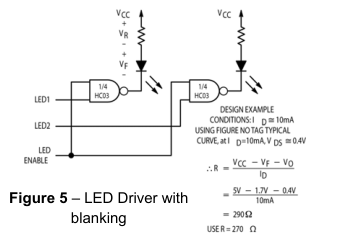

Page 5 of 5