

 Download PDF
3650 BURR-BROWN
Document overview
- PDF pages: 13
Technical content
Page 1
SBOS129
Page 2
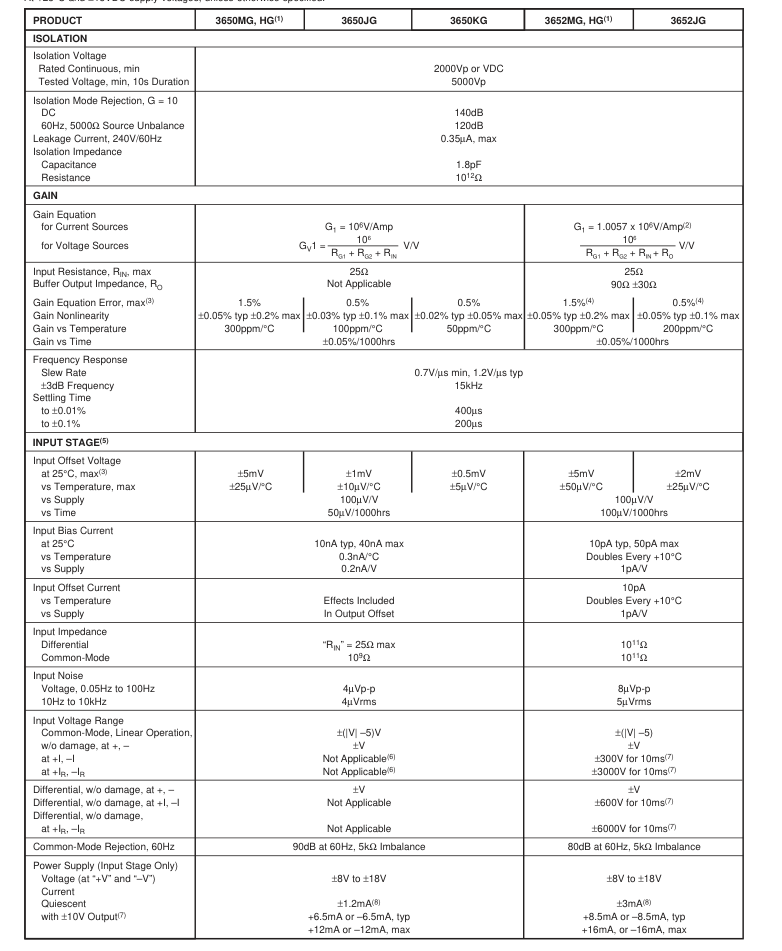
SPECIFICATIONS
At +25°C and ±15VDC supply voltages, unless otherwise specified.
Page 3
SPECIFICATIONS (CONT)
At +25°C and ±15VDC supply voltages, unless otherwise specified.
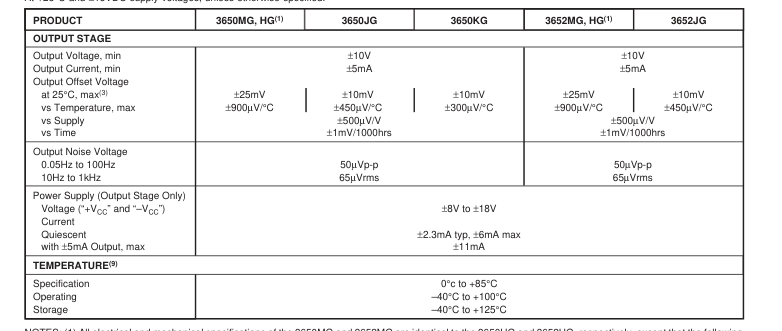
NOTES: (1) All electrical and mechanical specifications of the 3650MG and 3652MG are identical to the 3650HG and 3652HG, respectively, except that the following specifications apply to the 3650MG and 3652MG: (a) Isolation test voltage duration increased from 10 seconds minimum to 60 seconds minimum; (b) Input offset voltage at 25°C, max: ±10mV; vs temperature max: ±100µV/°C; (c) Output offset voltage at 25°C, max; ±50mV; vs temperature max; ±1.8mV/°C. (2) If used as 3650, see Installation and Operating Instructions. (3) Trimmable to zero. (4) Gain error terms specified for inputs applied through buffer amplifiers (i.e., ±1 or ±IR pins). (5) Input
stage specifications at +I and –I inputs for 3652 unless otherwise noted. (6) Maximum safe input current at either input is 10mA. (7) Continuous rating is 1/3 pulse rating. (8) Load current is drawn from one supply lead at a time: other supply current at quiescent level. For 3652 add 0.2mA/V of positive CMV. (9) dT/dt < 1°C/minute below 0°C, and long-term storage above 100°C is not recommended. Also limit the repeated thermal cycles to be within the 0°C to +85°C temperature range.
PACKAGE INFORMATION
PIN CONFIGURATIONS
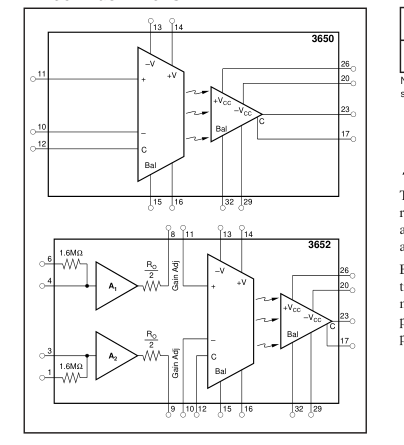
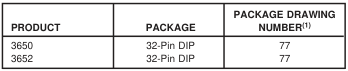
NOTE: (1) For detailed drawing and dimension table, please see end of data sheet, or Appendix C of Burr-Brown IC Data Book.
ELECTROSTATIC
DISCHARGE SENSITIVITY
This integrated circuit can be damaged by ESD. Burr-Brown
recommends that all integrated circuits be handled with
appropriate precautions. Failure to observe proper handling
and installation procedures can cause damage. ESD damage can range from subtle performance degrada-
tion to complete device failure. Precision integrated circuits
may be more susceptible to damage because very small
parametric changes could cause the device not to meet its
published specifications.
The information provided herein is believed to be reliable; however, BURR-BROWN assumes no responsibility for inaccuracies or omissions. BURR-BROWN assumes no responsibility for the use of this information, and all use of such information shall be entirely at the user’s own risk. Prices and specifications are subject to change without notice. No patent rights or licenses to any of the circuits described herein are implied or granted to any third party. BURR-BROWN does not authorize or warrant any BURR-BROWN product for use in life support devices and/or systems.
Page 4
TYPICAL PERFORMANCE CURVES
Typical at +25°C and ±15VDC power supplies, unless otherwise noted.
INPUT STAGE SUPPLY CURRENT vs OUTPUT VOLTAGE
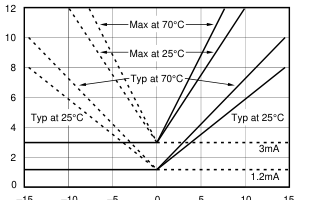
–10 –5 0 5 10
–15
15
Output Voltage (V)
at V–
Add 2mA typ, 4mA max for 3652
at V+
NORMALIZED LINEARITY vs TEMPERATURE
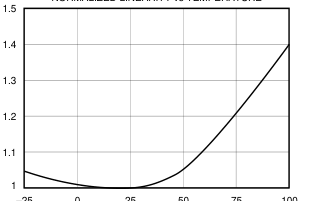
–25 0 25 50 75 100
Temperature (°C)
DISTORTION vs FREQUENCY
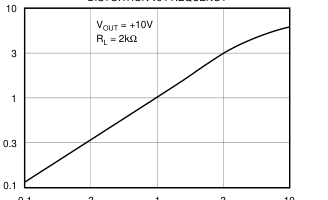
0.1
10
3 1 3
Frequency (kHz)
ISOLATION LEAKAGE CURRENT vs ISOLATION VOLTAGE
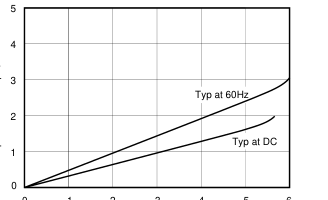
1 2 3 4 5
0
6
Isolation Voltage (kV)
REJECTION vs RESISTOR IMBALANCE 160
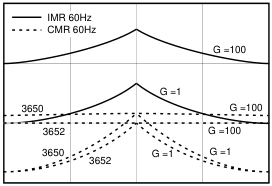
120
80
40 0
1
0.25 0.50 0.75
Input Resistor Imbalance
RG2
RG1 or RG1 + RG2
RG1 + RG2
GAIN ERROR vs FREQUENCY
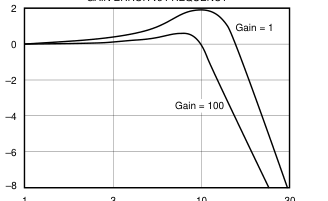
1
3
10
30
Frequency (kHz)
Page 5
TYPICAL PERFORMANCE CURVES (CONT)
Typical at +25°C and ±15VDC power supplies, unless otherwise noted.
OUTPUT VOLTAGE SWING vs INPUT SUPPLY VOLTAGE
PHASE SHIFT vs FREQUENCY
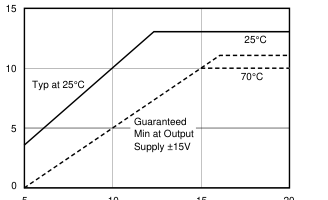
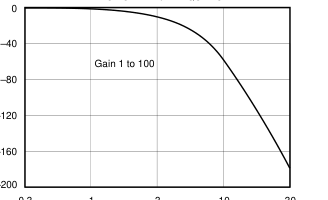
0.3 1 3 10 30
5
Frequency (kHz)
3650 COMMON-MODE AND ISOLATION-MODE REJECTION vs GAIN
20
10
15
Input Supply Voltage (V)
3652 COMMON-MODE AND ISOLATION-MODE REJECTION vs GAIN
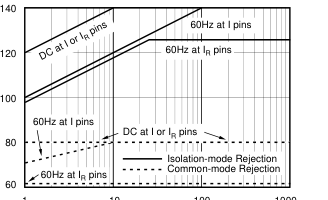
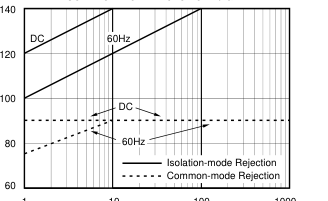
1
10
100
1000
1
10
100
1000
Gain
Gain
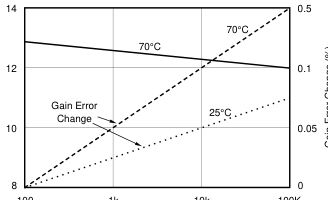
OUTPUT VOLTAGE AND GAIN ERROR vs TIME
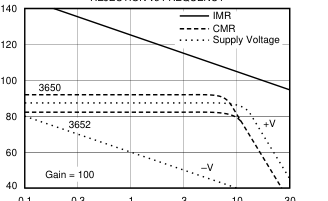
REJECTION vs FREQUENCY
0.3 1 3 10 30
0.1
100
100K
1k
10k
Frequency (kHz)
Time of Operation (Hours)
Page 6
DEFINITIONS
ISOLATION-MODE VOLTAGE, VISO
The isolation-mode voltage is the voltage which appears across the isolation barrier, i.e., between the input common and the output common. (See Figure 1.) Two isolation voltages are given in the electrical specifications: “rated continuous” and “test voltage”. Since it is impractical on a production basis to test a “continuous” voltage (infinite test time is implied), it is a generally accepted practice to test at a significantly higher voltage for some reasonable length of time. For the 3650 and 3652, the “test voltage” is equal to 1000V plus two times the “rated continuous” voltage. Thus, for a continuous rating of 2000V, each unit is tested at 5000V.
COMMON-MODE VOLTAGE, VCM
The common-mode voltage is the voltage midway between the two inputs of the amplifier measured with respect to input common. It is the algebraic average of the voltage applied at the amplifiers’ input terminals. In the circuit in Figure 1, (V+ + V–)/2 = VCM. (NOTE: Many applications involve a large system “common-mode voltage.” Usually in such cases the term defined here as “VCM” is negligible and the system “common-mode voltage” is applied to the amplifier as “VISO” in Figure 1.)
ISOLATION-MODE REJECTION
The isolation-mode rejection is defined by the equation in Figure 1. The isolation-mode rejection is not infinite be- cause there is some leakage across the isolation barrier due to the isolation resistance and capacitance.
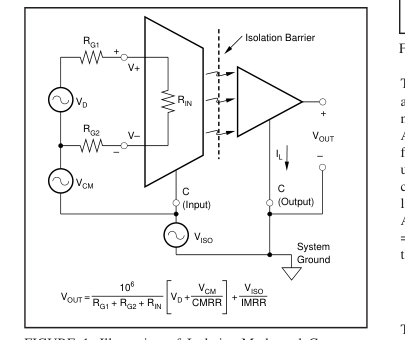
FIGURE 1. Illustration of Isolation-Mode and Common-
Mode Specifications.
NOTE: (1) The only effect of decreased LED output is a slight decrease in full scale swing capability. See Typical Performance Curves.
NONLINEARITY
Nonlinearity is specified to be the peak deviation from a best straightline expressed as a percent of peak-to-peak full scale output (i.e. ±10mV at 20Vp-p ≈ 0.05%).
THEORY OF OPERATION
Prior to the introduction of the 3650 family optical isolation had not been practical in linear circuits. A single LED and photodiode combination, while useful in a wide range of digital isolation applications, has fundamental limitations— primarily nonlinearity and instability as a function of time and temperature. The 3650 and 3652 use a unique technique to overcome the limitations of the single LED and photodiode isolator. Figure 2 is an elementary equivalent circuit for the 3650, which can be used to understand the basic operation without considering the cluttering details of offset adjustment and biasing for bipolar operation.
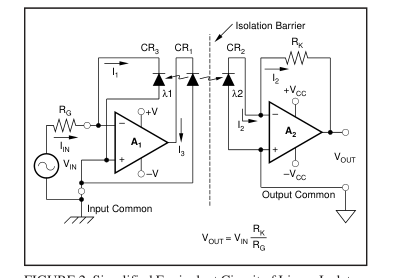
FIGURE 2. Simplified Equivalent Circuit of Linear Isolator.
Two matched photodiodes are used—one in the input (CR3) and one in the output stage (CR2)—to greatly reduce nonlinearities and time-temperature instabilities. Amplifier A1, LED CR1, and photodiode CR3 are used in a negative feedback configuration such that I1 = IIN RG (where RG is the user supplied gain setting resistor). Since CR2 and CR3 are closely matched, and since they receive equal amounts of light from the LED CR1 (i.e., λ1 = λ2), I2 = I1 = IIN. Amplifier A2 is connected as a current-to-voltage converter with VOUT = I2 RK where RK is an internal 1MΩ scaling resistor. Thus the overall transfer function is:
106
VOUT = VIN , (RG in Ωs)
RG
This improved isolator circuit overcomes the primary limitations of the single LED and photodiode combination. The transfer function is now virtually independent of any degradation in the LED output as long as the two photodiodes and optics are closely matched(1). Linearity is now a
Page 7
function of the accuracy of the matching and is further enhanced by the use of negative feedback in the input stage. Advanced laser trimming techniques are used to further compensate for residual matching errors. A model of the 3650 suitable for simple circuit analysis is shown in Figure 3. The output is a current dependent voltage source, VD, whose value depends on the input current. Thus, the 3650 is a transconductance amplifier with a gain of one volt per microamp. When voltage sources are used, the input current is derived by using gain setting resistors in series with the voltage source (see Installation and Operating Instructions for details). RIN is the differential input imped-
ance. The common-mode and isolation impedances are very high and are assumed to be infinite for this model.
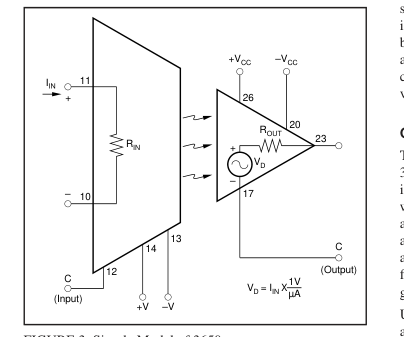
FIGURE 3. Simple Model of 3650. A simplified model of the 3652 is shown in Figure 4. The isolation and output stages are identical to the 3650. Additional input circuitry consisting of FET buffer amplifiers and input protection resistors have been added to give higher differential and common-mode input impedance (1011Ω),
lower bias currents (50pA) and overvoltage protection. The +IR and –IR inputs have a 10ms pulse rating of 6000V differential and 3000V common-mode (see Definitions for a discussion of common-mode and isolation-mode voltages.) The addition of the buffer amplifiers also creates a voltagein voltage-out transfer function with the gain set by RG1 and RG2.
INSTALLATION AND
OPERATING INSTRUCTIONS
POWER SUPPLY CONNECTIONS
The power supply connections for the 3650 and 3652 are shown in Figure 5. When a DC/DC converter is used for isolated power, it is placed in parallel with the isolation barrier of the amplifier. This can lower the isolation impedance and degrade the isolation-mode rejection of the overall circuit. Therefore, a high quality, low leakage DC/DC converter such as the Burr-Brown Model 722 should be used.
OFFSET VOLTAGE ADJUSTMENTS
The offset nulling circuits are identical for the 3650 and 3652 and are shown in Figure 5. The offset adjust circuitry is optional and the units will meet the stated specifications with the BAL terminals unconnected. Provisions are available to null both the input and output stage offsets. If the amplifier is operated at a fixed gain, normally only one adjustment will be used: the output stage (10kΩ adjustment) for low gains and the input stage (50kΩ adjustment) for high gains, (>10). Use the following procedure if it is desired to null both input and output components. (For example, if the gain of the amplifier is to be switched). The input stage offset is first
nulled (50kΩ adjustment) with the appropriate input signal pins connected to input common and the amplifier set at its maximum gain. The gain is then set to its minimum value and the output offset is nulled (10kΩ adjustment).
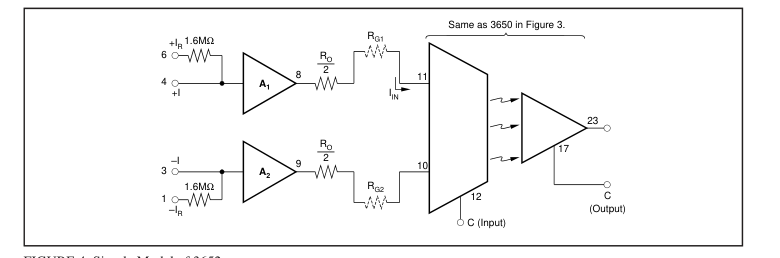
FIGURE 4. Simple Model of 3652.
Page 8
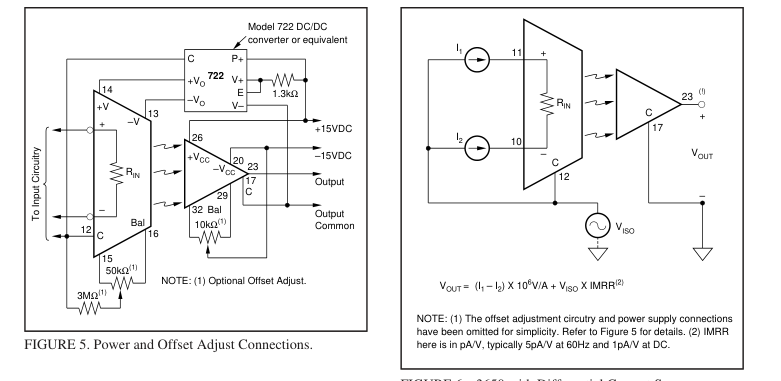
INPUT CONFIGURATIONS
Some possible input configurations for the 3650 and 3652 are shown in Figures 6a, 6b, 6c. Differential input sources are used in these examples. For situations with nondifferential inputs, the appropriate source term should be set to zero in the gain equations and replaced with a short in the diagrams. Figure 6a shows the 3650 connected as a transconductance amplifier with input current sources. Voltage sources are shown in Figure 6b. In this case the voltages are converted to currents by RG1 and RG2. As shown by the equations, they perform as gain setting resistors in the voltage transfer function. When a single voltage source is used, it is recommended (but not essential) that the gain setting resistor
remain split into two equal halves in order to minimize errors due to bias currents and common-mode rejection (see Typical Performance Curves). Figure 6c illustrates the connections for the 3652 when the FET buffer amplifiers, A1 and A2, are used. This configuration provides an isolation amplifier with high input impedance (both common-mode and differential, and good common-mode and isolation-mode rejection. It is a true isolated instrumentation amplifier which has many benefits for noise rejection when source impedance imbalances are present. In the 3652, the voltage gain of the buffer amplifiers is slightly less than unity, but the gain of the output stage has
been raised to compensate for this so that the overall transfer function from the ±I or ±IR inputs to the output is correct. It should be noted that A1 and A2 are buffer amplifiers. No summing can be done at the ±I or ±IR inputs. Figure 6c shows the +I and –I inputs used. If more input voltage protection is desired, then the +IR and –IR inputs should be used. This will increase the input noise due to the contribution from the 1.6MΩ resistors, but will provide additional differential and common-mode protection (10ms rating of 3kV).
FIGURE 6a. 3650 with Differential Current Sources.
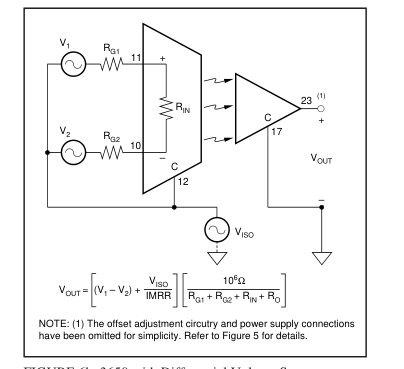
FIGURE 6b. 3650 with Differential Voltage Sources.
ERROR ANALYSIS
A model of the 3650 suitable for DC error analysis of offset voltage, voltage drift versus temperature, bias current, etc., is shown in Figure 7. A1 and A2, the input and output stage amplifiers, are considered to be ideal. Separate external generators are used to model the offset voltages and bias currents. RIN is assumed to be small relative to RG1 and RG2 and is therefore omitted from the gain equation. The feedback configuration, optics and component matching are such that I1 = I2 = I3 = I4. A simple circuit analysis gives the following expression for the
Page 9
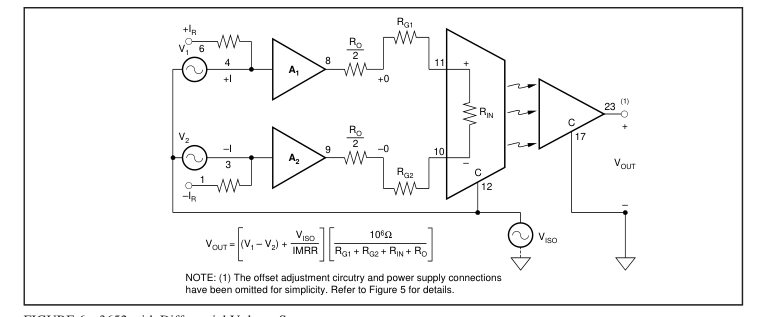
FIGURE 6c. 3652 with Differential Voltage Sources.
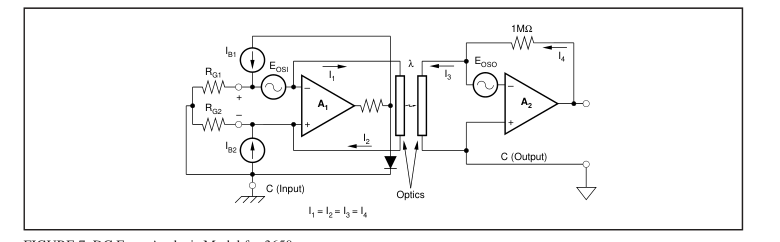
FIGURE 7. DC Error Analysis Model for 3650.
total output error voltage due to offset voltages and bias currents.
106
VOUT-TOTAL = [EOSI + (IB1 RGI – IB2 RG2)]+ EOSO (1)
RG1 + RG2
Offset current is defined as the difference between the two bias currents IB1 and IB2. If IB1 = IB and IB2 = IB +IOSI
106 IOS
then, for RG1 = RG2, VOUT – IB =
2
This component of error is not a function of gain and is therefore included as a part of EOSO specifications. The output errors due to the output stage bias current are also included in EOSO. This results in a very simple equation for the total error:
106 EOSI
VOUT-TOTAL = + EOSO (for RG1 = RG2). (2)
2RG1
In summary, it should be noted that equation (2) should be used only when RG1 = RG2. When RG1 ≠ RG2, equation (1) applies.
The effects of temperature may be analyzed by replacing the offset terms with their corresponding temperature gradient terms: VOUT ©∆ VOUT/∆T, EOSI ©∆EOSI/∆T, etc. For a complete analysis of the effects of temperature, gain variations must also be considered.
OUTPUT NOISE
The total output noise is given by: EN (RMS) = √(ENIG)2 + (ENO)2 where EN (RMS) = Total output noise ENI = RMS noise of the input stage ENO = RMS noise of the output stage G = 106/(RG1 + RG2) ENO includes the noise contribution due to the optics and the noise currents of the output stage. Errors created by the noise current of the input stage are insignificant compared to other noise sources and are therefore omitted.
Page 10
COMMON-MODE AND
ISOLATION-MODE REJECTION
The expression for the output error due to common-mode and isolation mode voltage is:
VISO VCM
VOUT = G +
CMRR IMRR
GUARDING AND PROTECTION
To preserve the excellent inherent isolation characteristics of these amplifiers, the following recommended practice should be noted. 1. Use shielded twisted pair of cable at the input as with any instrumentation amplifier. 2. Care should be taken to minimize external capacitance. A symmetrical layout of external components to achieve balanced capacitance from the input terminals to output common will preserve high IMR. 3. External components and conductor patterns should be at a distance equal to or greater than the distance between the input and output terminals to prevent HV breakdown. 4. Though not an absolute requirement, the use of laminated or conformally coated printed circuit boards is
recommended.
APPLICATIONS
Figure 8 shows a system where isolation amplifiers (3650) are used to measure the armature current and the armature voltage of a motor. The armature current of the motor is converted to a voltage by the calibrated shunt RS and then amplifier (adjustable gain) and isolated by the 3650. The armature voltage is sensed by the voltage divider (ad- justable) shown and then amplified and isolated by the 3650. The 3650 provides the advantage of accurate current measurement in the presence of high common-mode voltage. Both 3650s provide the advantage of isolating the motor ground from the control system ground. Isolated power is provided by an isolated DC/DC converter (BB Model 722 or
equivalent). The 3652 is ideally suited for patient monitoring applications as shown in Figure 9. The fact that it is a true balanced input instrumentation amplifier with very high differential and common-mode impedance means that it can greatly reduce the common-mode noise pick up due to imbalance in lead impedances that often appear in patient monitoring situations. The 3kV and 6kV shown in Figure 9 are the 10ms pulse ratings of the +IR and –IR inputs for the common-mode and differential input voltages with respect to input common. The rating of the isolation barrier is 2000Vpk continu-
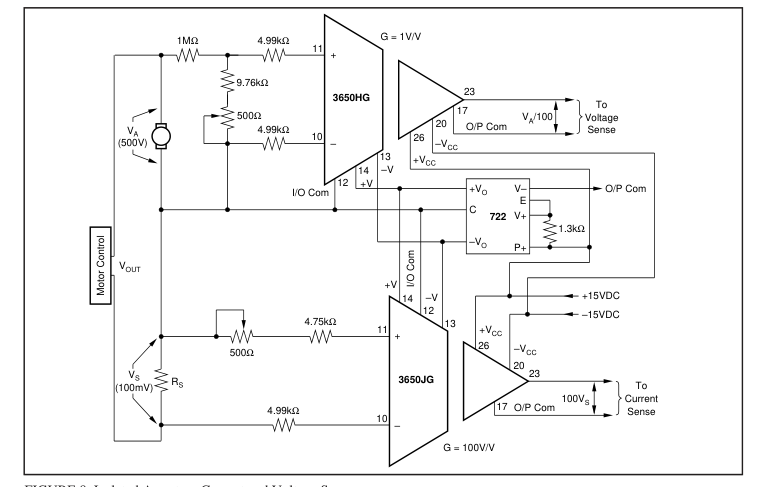
FIGURE 8. Isolated Armature Current and Voltage Sensor.
Page 11
ous. The nonrecurrent pulse rating of the isolation barrier is
5000Vpk, since each unit is factory tested at 5000Vpk. If the
isolation barrier is to be subjected to higher voltages a gas
filled surge voltage protection device can be used. For
multichannel operation, two 3652s can be powered by one
Model 722 isolated DC/DC converter. The total leakage
current for both channels at 240V 60Hz would still be less
than 2µA. The block diagram in Figure 10 shows the use of isolation
amplifiers in SCR control application.
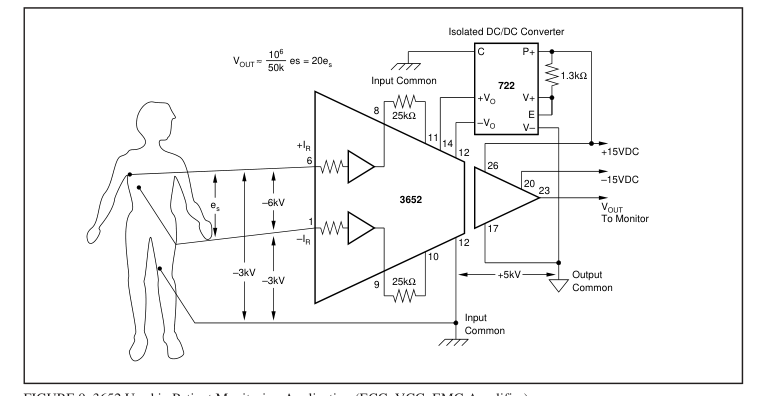
FIGURE 9. 3652 Used in Patient Monitoring Application (ECG, VCG, EMG Amplifier).
Page 12
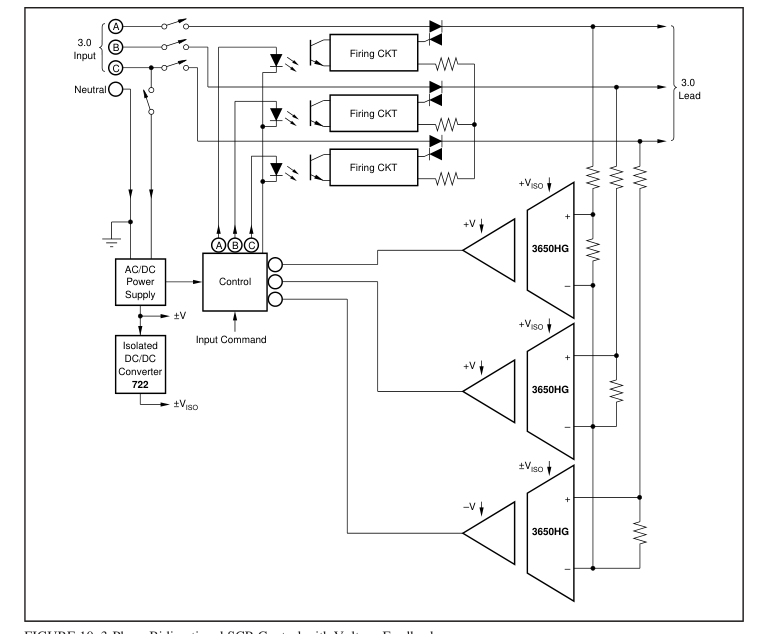
FIGURE 10. 3-Phase Bidirectional SCR Control with Voltage Feedback.
Page 13
IMPORTANT NOTICE
Texas Instruments and its subsidiaries (TI) reserve the right to make changes to their products or to discontinue any product or service without notice, and advise customers to obtain the latest version of relevant information to verify, before placing orders, that information being relied on is current and complete. All products are sold subject to the terms and conditions of sale supplied at the time of order acknowledgment, including those pertaining to warranty, patent infringement, and limitation of liability.
TI warrants performance of its semiconductor products to the specifications applicable at the time of sale in accordance with TI’s standard warranty. Testing and other quality control techniques are utilized to the extent TI deems necessary to support this warranty. Specific testing of all parameters of each device is not necessarily performed, except those mandated by government requirements.
Customers are responsible for their applications using TI components.
In order to minimize risks associated with the customer’s applications, adequate design and operating safeguards must be provided by the customer to minimize inherent or procedural hazards.
TI assumes no liability for applications assistance or customer product design. TI does not warrant or represent that any license, either express or implied, is granted under any patent right, copyright, mask work right, or other intellectual property right of TI covering or relating to any combination, machine, or process in which such semiconductor products or services might be or are used. TI’s publication of information regarding any third party’s products or services does not constitute TI’s approval, warranty or endorsement thereof.
Copyright 2000, Texas Instruments Incorporated