

 Download PDF
09HSI-S042-R0-CHT HIROSE
Document overview
- PDF pages: 71
Technical content
Page 1
Signal Integrity Report
IT3 Mezzanine Connector (17mm)
Version 1.0
November 25, 2009
09HSI-S042-R0-CHT


Copyright © 2009 Hirose Electric USA, Inc.
Page 2
Page ii
Table of Contents
Table of Contents.......................................................................................................................... ii 1. Introduction..............................................................................................................................4 2. Geometry ..................................................................................................................................4 3. Differential Signals ..................................................................................................................5 3.1 Frequency-Domain Modeling...................................................................................................... 5
3.1.1 S parameters (connector only)................................................................................................. 5 3.1.2 S parameters (vias only)........................................................................................................ 15 3.1.3 S parameters (vias + connector + vias) ................................................................................. 18 3.1.4 W-element Model (PCB trace).............................................................................................. 23 3.2 Time-Domain Simulation.......................................................................................................... 26
3.2.1 Impedance Profile (connector only)...................................................................................... 26 3.2.2 Impedance Profile (vias + connector + vias)......................................................................... 28 3.2.3 TDR and TDT waveforms (connector only)......................................................................... 29 3.2.4 Time-Domain Crosstalk (connector only)............................................................................. 35 3.2.5 System Voltage and Timing Margins.................................................................................... 36 4. Single-ended Signals ..............................................................................................................46
4.1 Frequency-Domain Modeling.................................................................................................... 46 4.1.1 S parameters (connector only)............................................................................................... 46 4.1.2 S parameters (vias only)........................................................................................................ 48 4.1.3 S parameters (vias + connector + vias) ................................................................................. 48 4.1.4 W-element Model (PCB trace).............................................................................................. 50
4.2 Time-Domain Simulation.......................................................................................................... 52 4.2.1 Impedance Profile (connector only)...................................................................................... 52 4.2.2 Impedance Profile (via + connector + via)............................................................................ 54 4.2.3 TDR and TDT waveforms (connector only)......................................................................... 56 4.2.4 Time-Domain Crosstalk (connector only)............................................................................. 58 4.2.5 System Voltage and Timing Margins.................................................................................... 58
- Measurement..........................................................................................................................60 5.1 Measurement Setup ................................................................................................................... 60 5.2 Differential Signals.................................................................................................................... 61 5.2.1 Measurement vs. Simulation Correlation (connector only) .................................................. 61 5.2.2 Time-Domain NEXT and FEXT........................................................................................... 65
5.2.3 Impedance profile.................................................................................................................. 66 5.3 Single-ended Signals ................................................................................................................. 66 5.3.1 Measurement vs. Simulation Correlation (connector only) .................................................. 66 5.3.2 Time-Domain NEXT and FEXT........................................................................................... 68 5.3.3 Impedance profile.................................................................................................................. 69
- Appendix.................................................................................................................................70
Page 3
Page iii
Revision History
| Name | Date | Reason For Changes | Version |
| Fernando Cheng | 11-25-09 | First created | 1.0 |
Page 4
Page 4
1. Introduction
The IT3 series is a high-speed mezzanine connector that is proven to work up to 20+ Gbps in a telecom environment. Its innovative three-piece design allows customers to easily adjust the stack height from 15 mm to 40 mm without changing the footprint or layout in their printed circuit boards. In the following sections, we will describe the IT3 geometry and the signal integrity analysis results for the 17mm stack height. The signal integrity results include the S parameters, TDR and TDT waveforms, and eye diagrams. The IT3-17mm connector complies with the IEEE 802.3ap spec for return loss (RL) and insertion loss to cross-talk ratio (ICR) to 20+ GHz, and introduces small timing jitter end eye height
attenuation.
2. Geometry
Figure 1 and Figure 2 show the geometry and structure of the IT3 connector: two identical sockets are connected to each other by an interposer. The total stack height is flexible. For example, the following customer-specific heights have been made available: 17, 25, 26, 28, 32, 38 and 40 mm.
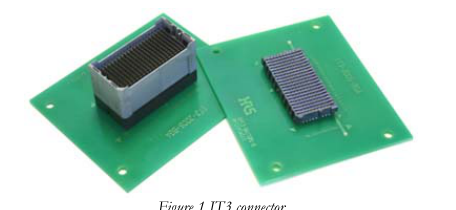
Figure 1 IT3 connector
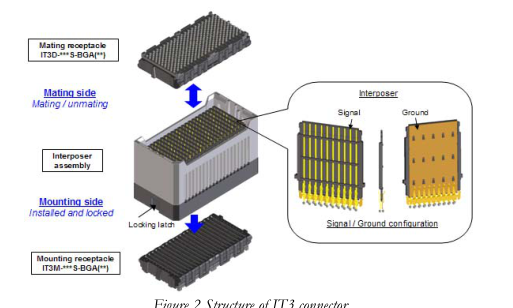
Figure 2 Structure of IT3 connector
Page 5
Page 5
Figure 3 shows the cross section of interposer. The loosely-coupled design gives 50.24 ohm impedance for single-ended signals and 98.87 ohm impedance for differential signals, with process variations. The line-to-line coupling is 0.80%, and the pair-to-pair coupling is 0.36%.
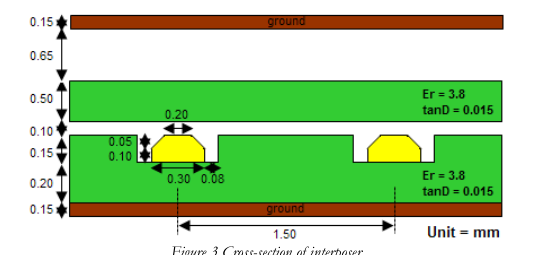
Figure 3 Cross-section of interposer
3. Differential Signals
3.1 Frequency-Domain Modeling
3.1.1 S parameters (connector only)
Figure 4 shows the simulation model for IT3-17 mm (connector only). We used symmetry to combine four quarter models created from HFSS into a 60-port single-ended Touchstone file. The 60-port single-ended model was then converted into a 30-port differential Touchstone file.
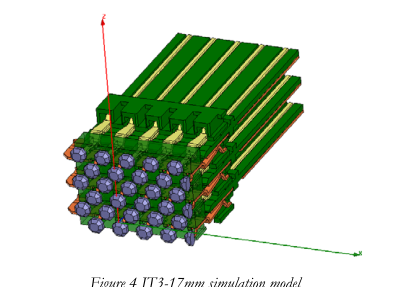
Figure 4 IT3-17mm simulation model
Page 6
Page 6
3.1.1.1 Fully populated pin assignment
For fully-populated pin assignment, as shown in Figure 5, Ports 1-2 are grouped into Pair 1, and Ports 3-4 are grouped into Pair 2, …, etc. Figure 6 shows the corresponding SDD for pair 8 (or Ports 15-16), where the insertion loss (IL), return loss (RL), and crosstalk can be clearly seen, and are summarized in Table 1. The impedance and trace delay values for each of the 15 differential pairs are shown in Table 2. Figure 7 shows the return loss (RL) comparison with the IEEE802.3ap spec for the center pair 8. Figure 8 - Figure 11 show the power sum and insertion-to-crosstalk ratio (ICR) profile comparison with the IEEE802.3ap spec of NEXT and FEXT, respectively.
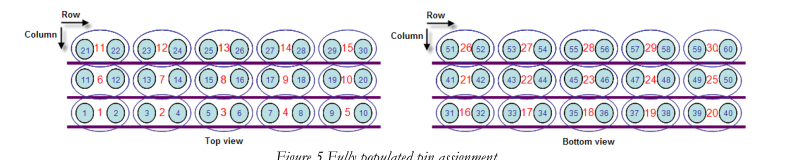
Figure 5 Fully populated pin assignment
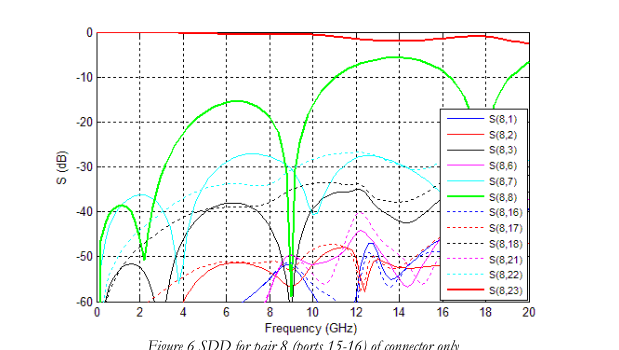
Figure 6 SDD for pair 8 (ports 15-16) of connector only
Page 7
Page 7
| FREQUENCY (GHZ) | INSERTION LOSS (DB) | RETURN LOSS (DB) | WORST PAIR-TO-PAIR NEXT (DB) | WORST PAIR-TO-PAIR FEXT (DB) |
| 1.25 | -0.087 | -38.61 | -38.01 | -48.05 |
| 1.5625 | -0.101 | -39.79 | -36.87 | -46.20 |
| 2.5 | -0.138 | -41.52 | -36.84 | -42.04 |
| 3.125 | -0.165 | -30.17 | -40.23 | -39.75 |
| 5 | -0.326 | -17.90 | -33.96 | -34.82 |
| 6.25 | -0.455 | -15.54 | -28.28 | -33.78 |
| 10 | -0.568 | -16.25 | -39.42 | -28.36 |
Table 1 Summary of SDD for pair 8 (ports 15-16) of connector only
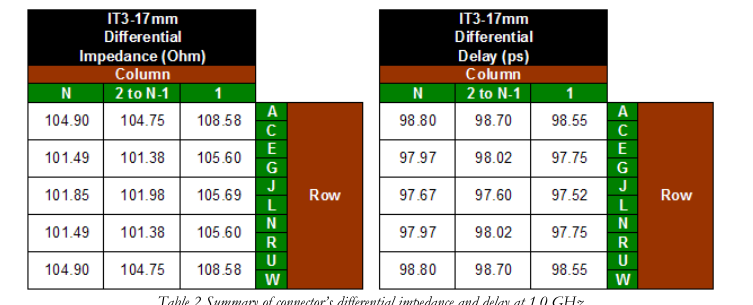
Table 2 Summary of connector’s differential impedance and delay at 1.0 GHz
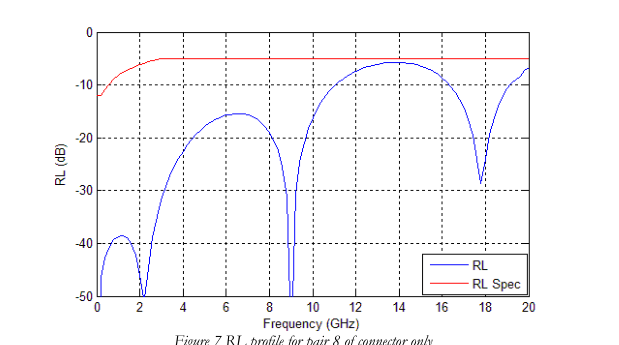
Figure 7 RL profile for pair 8 of connector only
Page 8
Page 8
The RL profile for the center pair of the IT3-17mm connector meets the IEEE 802.3ap spec up to 20+ GHz. The RL profile for the full channel model (connector, vias and PCB traces) is also good for 20+ GHz, which will be shown in Section 3.1.4.
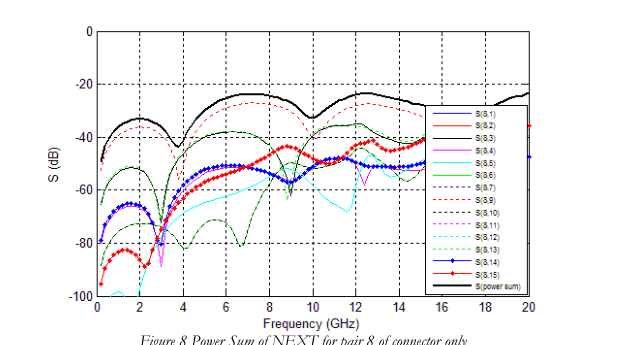
Figure 8 Power Sum of NEXT for pair 8 of connector only
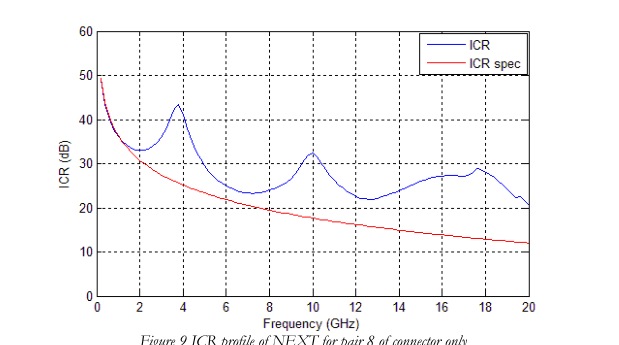
Figure 9 ICR profile of NEXT for pair 8 of connector only
Page 9
Page 9
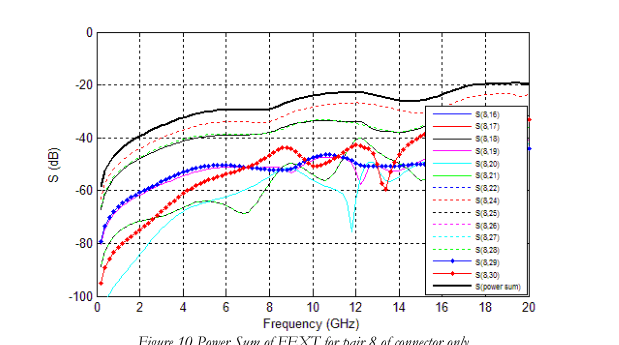
Figure 10 Power Sum of FEXT for pair 8 of connector only
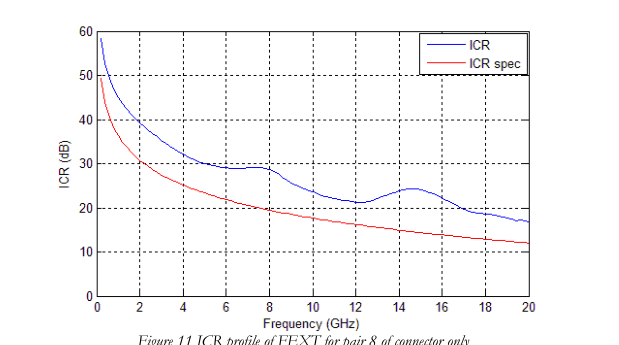
Figure 11 ICR profile of FEXT for pair 8 of connector only
The ICR profile for NEXT is not as critical since the TX and RX wafers can be grouped separately. The ICR profile for FEXT satisfies the IEEE 802.3ap spec up to 20GHz. For further ICR improvement, some pins can be “skipped”. In this document, we will analyze the IT3 with 60% and 50% pin density assignment. For non-fully-populated pin assignments, the skipped pins are terminated each to 50Ω to avoid resonance.
Page 10
Page 10
3.1.1.2 60% density pin assignment
Figure 13 shows the corresponding SDD for pair 4 for 60% pin density configuration. The SDD
results are summarized in Table 3. Figure 14 - Figure 15 and Figure 16 - Figure 17 show the power sum and ICR profile comparison with the IEEE 802.3ap spec for NEXT and FEXT, respectively.

Figure 12 60% density pin assignment
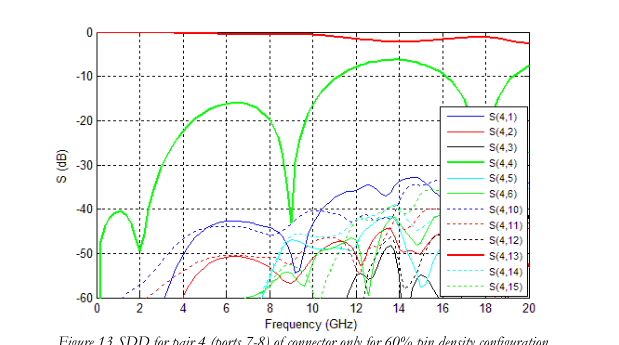
Figure 13 SDD for pair 4 (ports 7-8) of connector only for 60% pin density configuration
| FREQUENCY (GHZ) | INSERTION LOSS (DB) | RETURN LOSS (DB) | WORST PAIR-TO-PAIR NEXT (DB) | WORST PAIR-TO-PAIR FEXT (DB) |
| 1.25 | -0.089 | -40.84 | -63.37 | -59.83 |
| 1.5625 | -0.104 | -42.83 | -62.53 | -58.52 |
| 2.5 | -0.143 | -38.11 | -61.19 | -54.82 |
| 3.125 | -0.172 | -29.20 | -60.16 | -51.13 |
| 5 | -0.341 | -18.12 | -44.62 | -44.31 |
| 6.25 | -0.459 | -16.02 | -41.90 | -43.86 |
| 10 | -0.606 | -16.43 | -43.33 | -40.41 |
Table 3 Summary of SDD for pair 4 (ports 7-8) of connector only for 60% pin density configuration
Page 11
Page 11
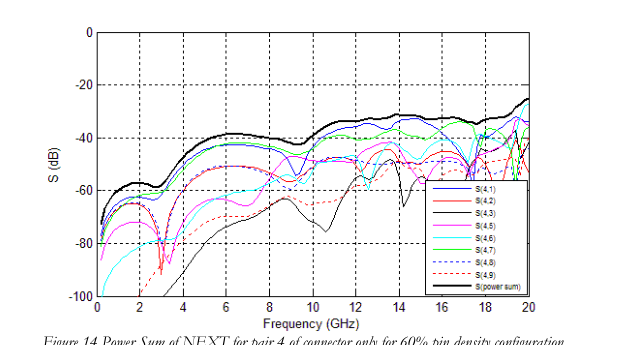
Figure 14 Power Sum of NEXT for pair 4 of connector only for 60% pin density configuration
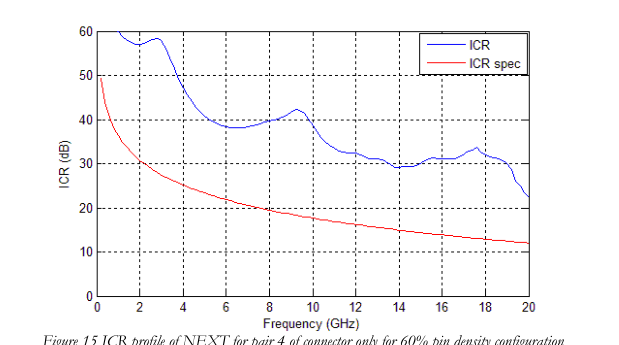
Figure 15 ICR profile of NEXT for pair 4 of connector only for 60% pin density configuration
Page 12
Page 12
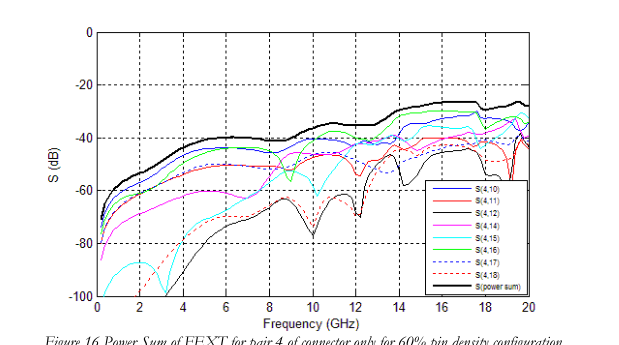
Figure 16 Power Sum of FEXT for pair 4 of connector only for 60% pin density configuration
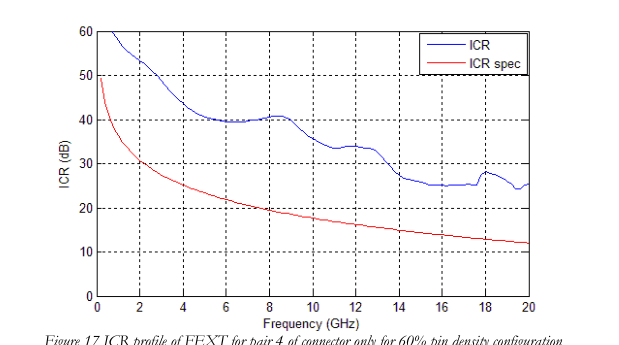
Figure 17 ICR profile of FEXT for pair 4 of connector only for 60% pin density configuration
3.1.1.3 50% density pin assignment
Figure 19 shows the corresponding SDD for pair 4 for 50% pin density configuration. The SDD results are summarized in Table 4. Figure 20 - Figure 21 and Figure 22 - Figure 23 show the power sum and ICR profile comparison with the IEEE 802.3ap spec for NEXT and FEXT, respectively.
Page 13
Page 13

Figure 18 50% density pin assignment
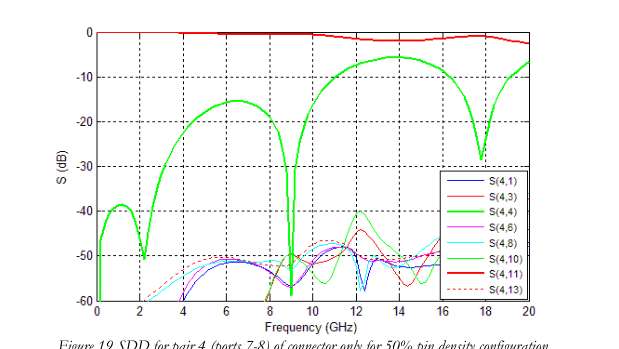
Figure 19 SDD for pair 4 (ports 7-8) of connector only for 50% pin density configuration
| FREQUENCY (GHZ) | INSERTION LOSS (DB) | RETURN LOSS (DB) | WORST PAIR-TO-PAIR NEXT (DB) | WORST PAIR-TO-PAIR FEXT (DB) |
| 1.25 | -0.087 | -38.60 | -65.55 | -64.36 |
| 1.5625 | -0.101 | -39.79 | -65.02 | -62.64 |
| 2.5 | -0.138 | -41.52 | -70.29 | -58.71 |
| 3.125 | -0.165 | -30.17 | -73.94 | -56.26 |
| 5 | -0.326 | -17.90 | -52.30 | -50.79 |
| 6.25 | -0.455 | -15.54 | -50.71 | -50.47 |
| 10 | -0.568 | -16.25 | -50.98 | -47.45 |
Table 4 Summary of SDD for pair 4 (ports 7-8) of connector only for 50% pin density configuration
Page 14
Page 14
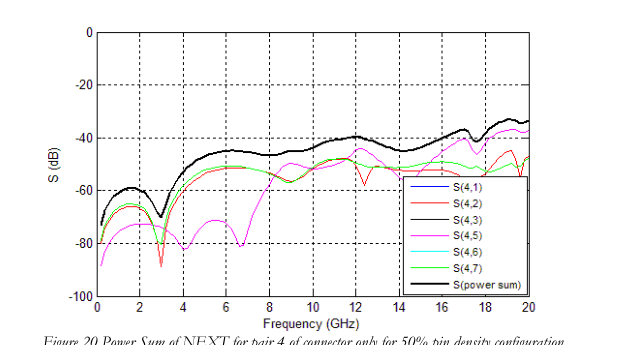
Figure 20 Power Sum of NEXT for pair 4 of connector only for 50% pin density configuration
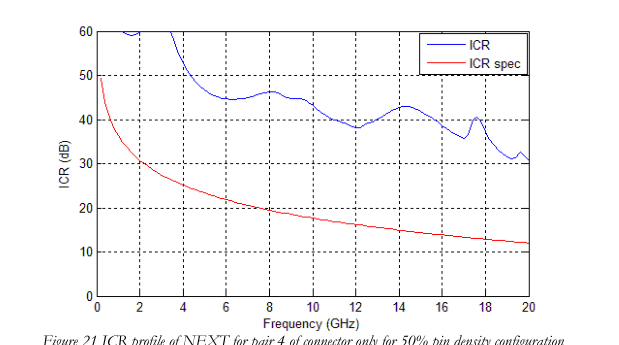
Figure 21 ICR profile of NEXT for pair 4 of connector only for 50% pin density configuration
Page 15
Page 15
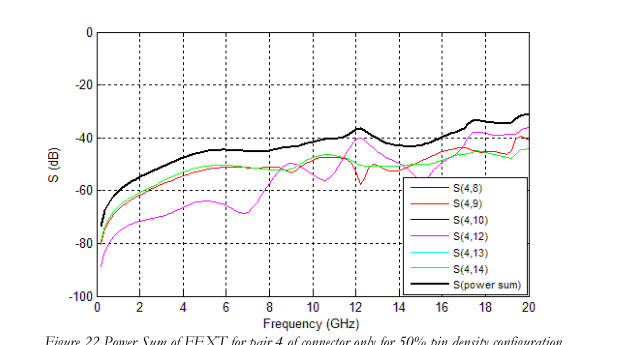
Figure 22 Power Sum of FEXT for pair 4 of connector only for 50% pin density configuration
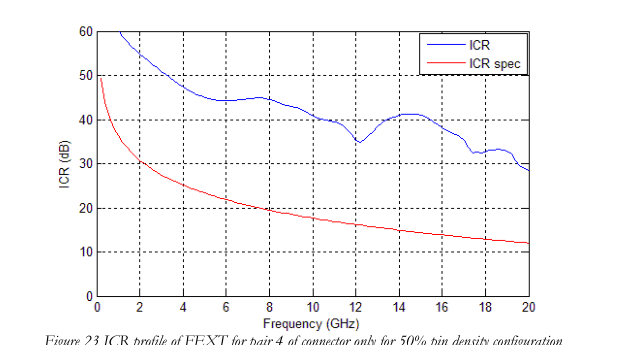
Figure 23 ICR profile of FEXT for pair 4 of connector only for 50% pin density configuration
3.1.2 S parameters (vias only)
The electrical performance of the via depends on the connector’s footprint and PCB stackup. The PCB stackup is usually customer-specific. An example is given in Figure 24. The stackup consists of 30 layers, totaling 121.78mil in thickness. To have ~100 Ohms differential impedance, the signal line width and spacing are set to 3.5 mil and 7.5 mil, respectively, with εr=3.80 and tanδ=0.01. The via models used in this document are extracted from the demo board. In this document, we consider the connector to be mounted from the top layer 1. Thus, a large layer number corresponds
Page 16
Page 16
to a short via stub (Note that in IT3_demo_board_v2.doc, a larger routing layer corresponds to a longer via-stub). The via transition through the middle layer 16 of the PCB was studied in order to test a relatively long via stub of ~60mil. Figure 25 shows the top and side views of the transition which includes the PCB layers of the traces connected to each via. Via models through layers 3, layer 12, layer 16, layer 19, and layer 28 have been modeled to study the effects of the insertion loss for short and long via stubs. Only three routing layers are needed to route all differential pairs on the IT3 connector (with two pairs exiting on one side and three on the other side of the connector, as
observed in Figure 25) The ports have been numbered such that 1 to 30 correspond to the top side of the PCB, and 31 to 60 are for the PCB trace connections. Ports 1-2 are grouped into pair 1, and ports 3-4 are grouped into pair 2, etc. Figure 26 shows the corresponding SDD for pair 8 (or ports 15-16) of via transition with PCB routing on layer 16.
| Layer No. | Mil | ||
| Solder mask | 0.5 | ||
| 1 | TOP | 2.84 | |
| Pre-preg | 4.5 | ||
| 2 | Ground | 0.7 | |
| Core | 3 | ||
| 3 | Sig 1 | 0.7 | |
| Pre-preg | 3.5 | ||
| 4 | Sig 2 | 0.7 | |
| Core | 3 | ||
| 5 | Ground | 0.7 | |
| Pre-preg | 3.5 | ||
| 6 | Ground | 0.7 | |
| Core | 3 | ||
| 7 | Sig 3 | 0.7 | |
| Pre-preg | 3.5 | ||
| 8 | Sig 4 | 0.7 | |
| Core | 3 | ||
| 9 | Ground | 0.7 | |
| Pre-preg | 3.5 | ||
| 10 | Ground | 0.7 | |
| Core | 3 | ||
| 11 | Sig 5 | 0.7 | |
| Pre-preg | 3.5 | ||
| 12 | Sig 6 | 0.7 | |
| Core | 3 | ||
| 13 | Ground | 0.7 | |
| Pre-preg | 3.5 | ||
| 14 | Ground | 0.7 | |
| Core | 3 | ||
| 15 | Sig 7 | 0.7 | |
| Pre-preg | 3.5 |
Page 17
Page 17
| 16 | Sig 8 | 0.7 | |
| Core | 3 | ||
| 17 | Ground | 0.7 | |
| Pre-preg | 3.5 | ||
| 18 | Ground | 0.7 | |
| Core | 3 | ||
| 19 | Sig 9 | 0.7 | |
| Pre-preg | 3.5 | ||
| 20 | Sig10 | 0.7 | |
| Core | 3 | ||
| 21 | Ground | 0.7 | |
| Pre-preg | 3.5 | ||
| 22 | Ground | 0.7 | |
| Core | 3 | ||
| 23 | Sig11 | 0.7 | |
| Pre-preg | 3.5 | ||
| 24 | Sig12 | 0.7 | |
| Core | 3 | ||
| 25 | Ground | 0.7 | |
| Pre-preg | 3.5 | ||
| 26 | Ground | 0.7 | |
| Core | 3 | ||
| 27 | Sig13 | 0.7 | |
| Pre-preg | 3.5 | ||
| 28 | Sig14 | 0.7 | |
| Core | 3 | ||
| 29 | Ground | 0.7 | |
| Pre-preg | 4.5 | ||
| 30 | BOTTOM | 2.84 | |
| Solder mask | 0.5 | ||
| Total thickness (mil) | 121.78 | ||
Figure 24 Sample PCB stackup
Page 18
Page 18
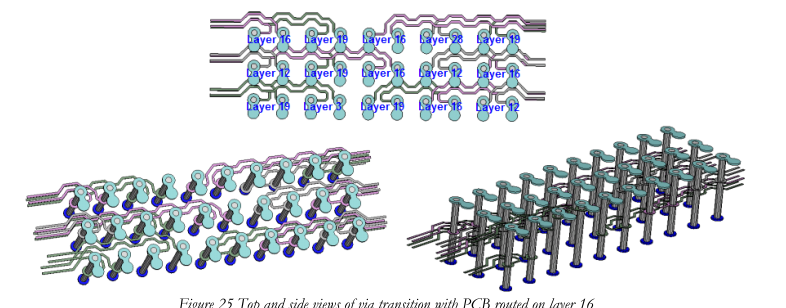
Figure 25 Top and side views of via transition with PCB routed on layer 16
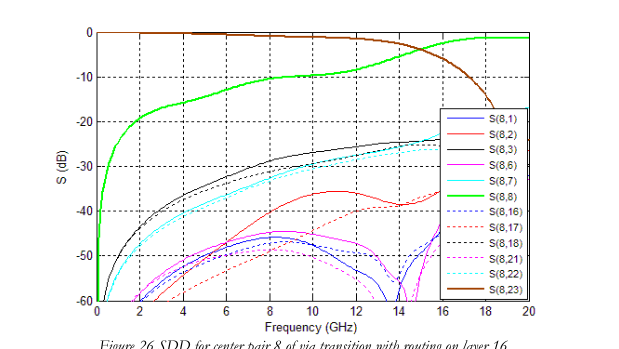
Figure 26 SDD for center pair 8 of via transition with routing on layer 16
3.1.3 S parameters (vias + connector + vias)
Figure 27 and Figure 32 show the SDD response (i.e., insertion loss, return loss, NEXT, and FEXT) for pair 8 and pair 4 for 100% and 50% pin density configuration of the cascaded vias/connector/vias with PCB routing in the 16th layer for both via transitions. All PCB traces coming out from the vias have been matched to 10.507mm. The results at various frequencies of interest are summarized in Table 5 and Table 6 for 100% and 50% pin density configuration respectively. Figure 28 - Figure 31 and Figure 33 - Figure 36 show the power sum and insertion-to- crosstalk ratio (ICR) profile comparison with the IEEE802.3ap spec of NEXT and FEXT for the different pin density configurations.
3.1.3.1 Fully populated pin assignment
Page 19
Page 19
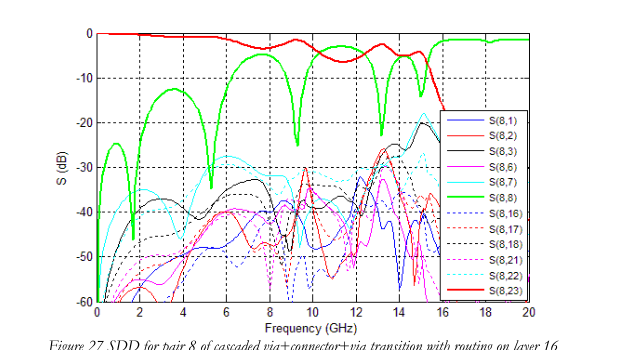
Figure 27 SDD for pair 8 of cascaded via+connector+via transition with routing on layer 16
| FREQUENCY (GHZ) | INSERTION LOSS (DB) | RETURN LOSS (DB) | WORST PAIR-TO-PAIR NEXT (DB) | WORST PAIR-TO-PAIR FEXT (DB) |
| 1.25 | -0.311 | -26.71 | -37.48 | -45.24 |
| 1.5625 | -0.352 | -36.66 | -36.02 | -42.78 |
| 2.5 | -0.590 | -17.03 | -35.30 | -39.17 |
| 3.125 | -0.816 | -13.28 | -38.21 | -38.84 |
| 5 | -0.888 | -22.01 | -31.15 | -31.44 |
| 6.25 | -1.666 | -9.94 | -27.03 | -28.49 |
| 10 | -3.270 | -6.20 | -32.10 | -30.93 |
Table 5 Summary of SDD for pair 8 of cascaded via+connector+via transition with routing on layer 16
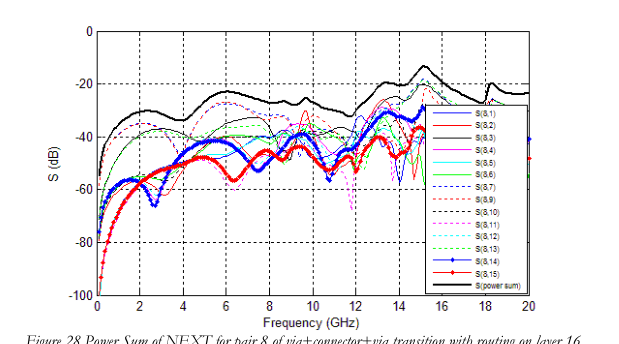
Figure 28 Power Sum of NEXT for pair 8 of via+connector+via transition with routing on layer 16
Page 20
Page 20
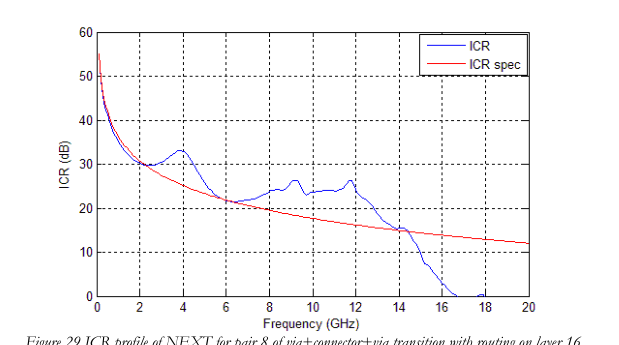
Figure 29 ICR profile of NEXT for pair 8 of via+connector+via transition with routing on layer 16
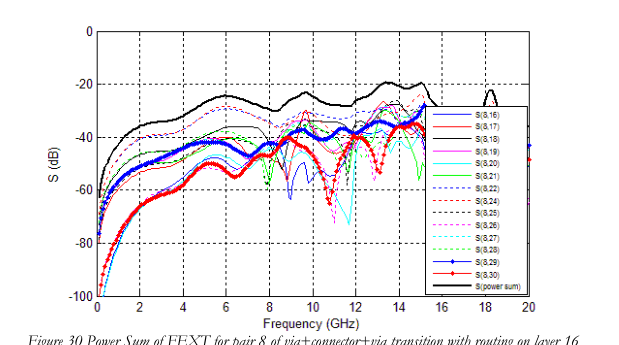
Figure 30 Power Sum of FEXT for pair 8 of via+connector+via transition with routing on layer 16
Page 21
Page 21
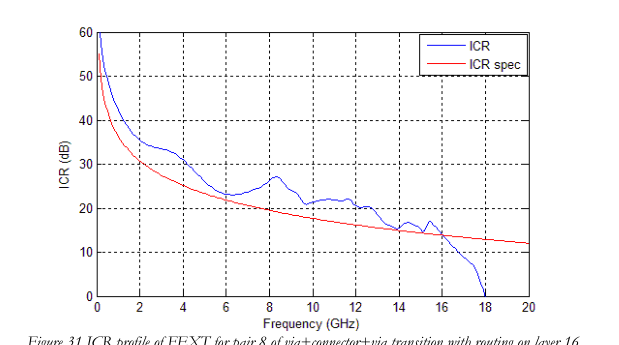
Figure 31 ICR profile of FEXT for pair 8 of via+connector+via transition with routing on layer 16
The ICR profile for NEXT is not as critical since the TX and RX wafers can be grouped separately. The ICR profile for FEXT satisfies the IEEE 802.3ap spec up to 16GHz. For further improvement of the ICR profile, skipped pins can be applied.
3.1.3.2 50% density pin assignment
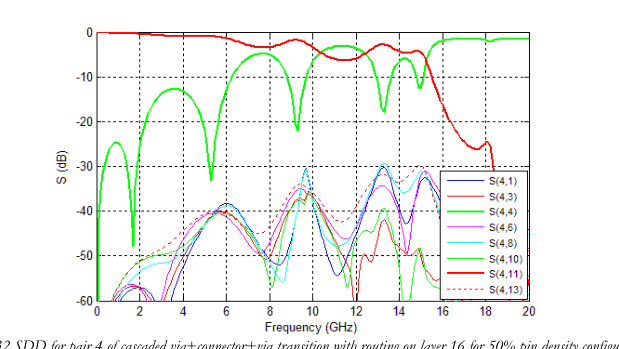
Figure 32 SDD for pair 4 of cascaded via+connector+via transition with routing on layer 16 for 50% pin density configuration
Page 22
Page 22
| FREQUENCY (GHZ) | INSERTION LOSS (DB) | RETURN LOSS (DB) | WORST PAIR-TO-PAIR NEXT (DB) | WORST PAIR-TO-PAIR FEXT (DB) |
| 1.25 | -0.312 | -26.64 | -56.91 | -54.73 |
| 1.5625 | -0.353 | -36.31 | -56.28 | -52.84 |
| 2.5 | -0.588 | -17.14 | -58.45 | -49.40 |
| 3.125 | -0.815 | -13.37 | -56.08 | -47.45 |
| 5 | -0.927 | -21.99 | -41.09 | -40.67 |
| 6.25 | -1.721 | -10.14 | -38.55 | -39.03 |
| 10 | -3.381 | -6.58 | -35.76 | -35.14 |
Table 6 Summary of SDD for pair 4 of cascaded via+connector+via transition with routing on layer 16 for 50% pin density
configuration
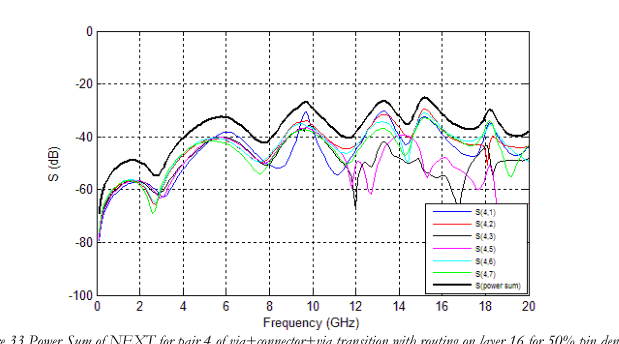
Figure 33 Power Sum of NEXT for pair 4 of via+connector+via transition with routing on layer 16 for 50% pin density
configuration
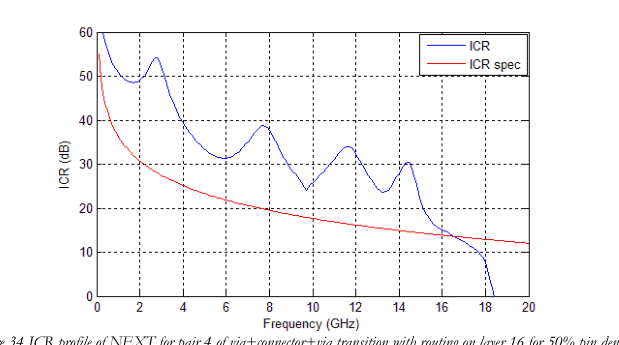
Figure 34 ICR profile of NEXT for pair 4 of via+connector+via transition with routing on layer 16 for 50% pin density
configuration
Page 23
Page 23
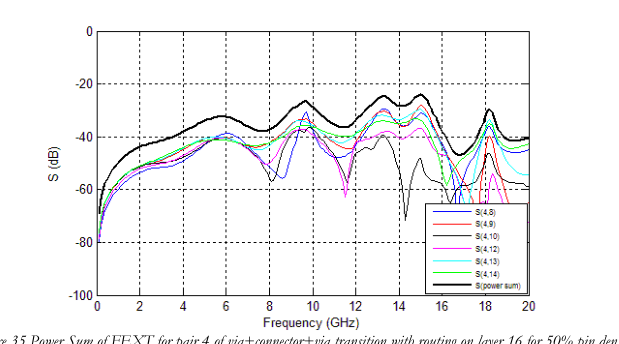
Figure 35 Power Sum of FEXT for pair 4 of via+connector+via transition with routing on layer 16 for 50% pin density
configuration
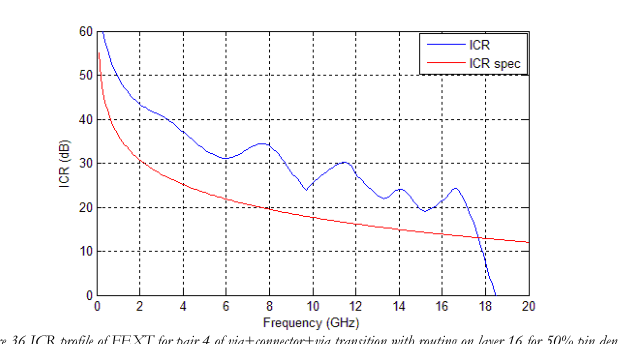
Figure 36 ICR profile of FEXT for pair 4 of via+connector+via transition with routing on layer 16 for 50% pin density
configuration
3.1.4 W-element Model (PCB trace)
The signal traces in the PCB follow the cross section in Figure 37 for 100 Ohms differential impedance. The corresponding W-element model and differential S parameters are shown in Figure 38 and Figure 39. The RL comparisons with the IEEE 802.3ap spec for the full channel model with the connector, vias and PCB traces of 76.2mm + 76.2mm (3” + 3”) and 152.4mm + 152.4mm (6” + 6”) are shown in Figure 40 and Figure 41.
Page 24
Page 24
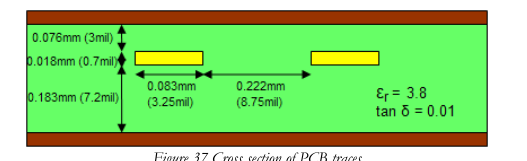
Figure 37 Cross section of PCB traces
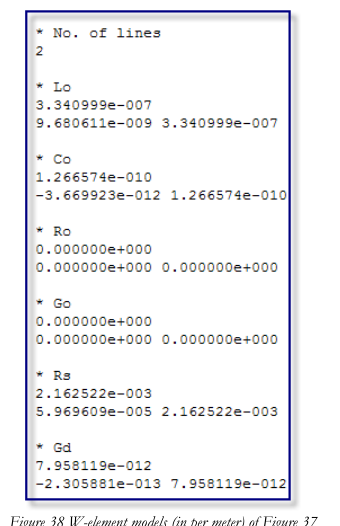
Figure 38 W-element models (in per meter) of Figure 37
Page 25
Page 25
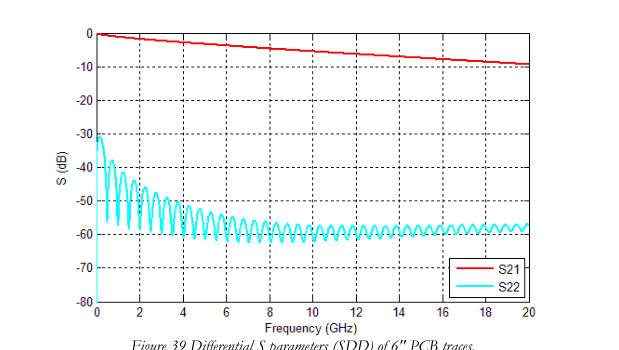
Figure 39 Differential S parameters (SDD) of 6" PCB traces.
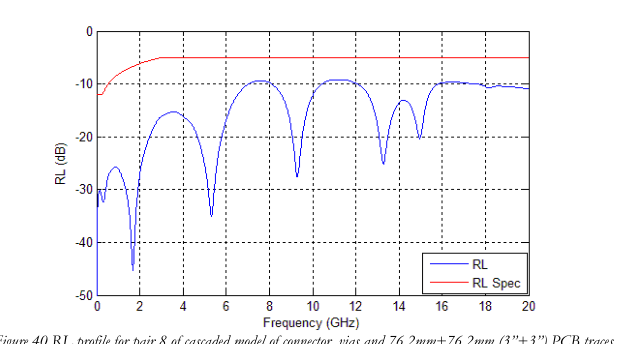
Figure 40 RL profile for pair 8 of cascaded model of connector, vias and 76.2mm+76.2mm (3”+3”) PCB traces
Page 26
Page 26
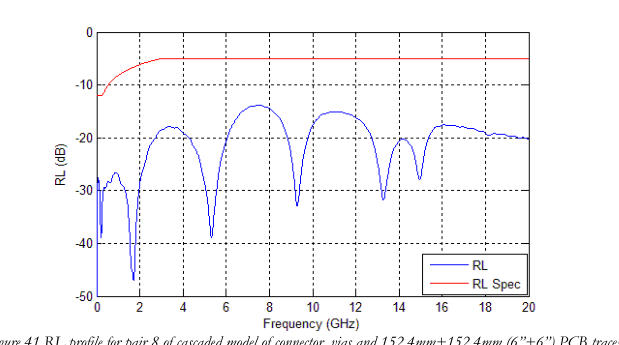
Figure 41 RL profile for pair 8 of cascaded model of connector, vias and 152.4mm+152.4mm (6”+6”) PCB traces
3.2 Time-Domain Simulation
3.2.1 Impedance Profile (connector only)
The impedance profiles for center pair 8, right edge pair 10, top edge pair 14, and top corner pair 15 of the fully populated model (connector only), as portrayed in Figure 42, are shown in Figure 43 - Figure 46.
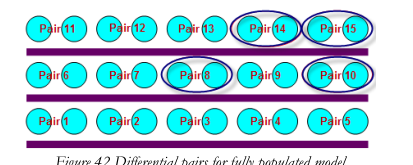
Figure 42 Differential pairs for fully populated model
Page 27
Page 27
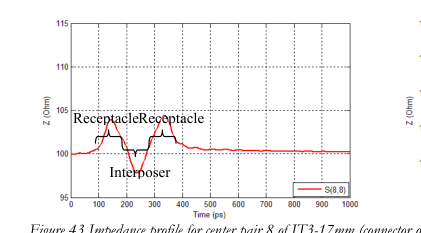
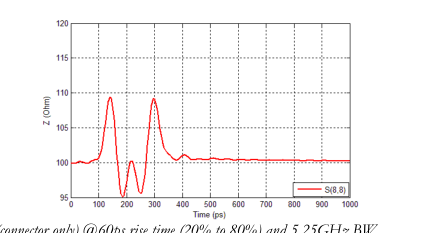
Figure 43 Impedance profile for center pair 8 of IT3-17mm (connector only) @60ps rise time (20% to 80%) and 5.25GHz BW,
and @30ps rise time (20% to 80%) and 10.5GHz BW
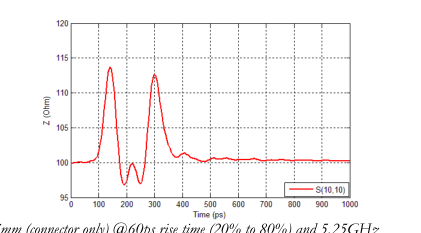
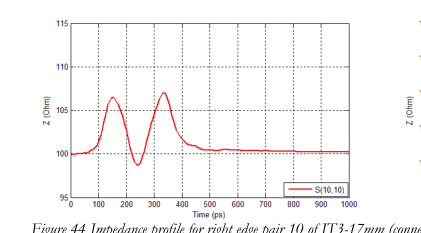
Figure 44 Impedance profile for right edge pair 10 of IT3-17mm (connector only) @60ps rise time (20% to 80%) and 5.25GHz
BW, and @30ps rise time (20% to 80%) and 10.5GHz BW
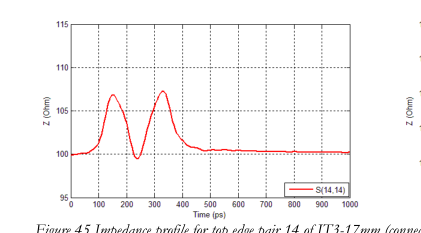
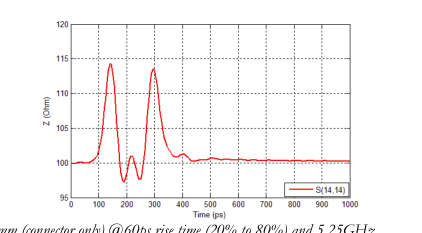
Figure 45 Impedance profile for top edge pair 14 of IT3-17mm (connector only) @60ps rise time (20% to 80%) and 5.25GHz
BW, and @30ps rise time (20% to 80%) and 10.5GHz BW
Page 28
Page 28
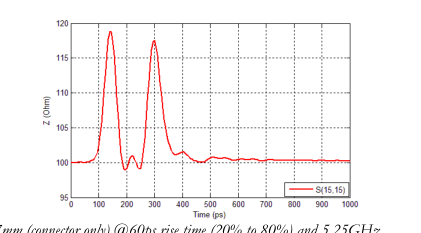
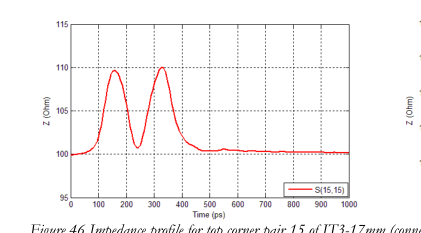
Figure 46 Impedance profile for top corner pair 15 of IT3-17mm (connector only) @60ps rise time (20% to 80%) and 5.25GHz
BW, and @30ps rise time (20% to 80%) and 10.5GHz BW
The receptacles show higher impedance in the connector-only TDR waveforms because IT3 was designed intentionally with slightly higher impedance in the receptacle to offset the via’s (and via stub’s) low impedance, as shown in the next section.
3.2.2 Impedance Profile (vias + connector + vias)
The impedance profiles for center pair 8, right edge pair 10, top edge pair 14, and top corner pair 15 of the fully populated model (vias + connector + vias), as portrayed in Figure 42, are shown in Figure 47, Figure 48, Figure 49 and Figure 50. The via models for center pair 8 and right edge pair 10 are routed on layer 16, the top edge pair 14 vias are routed on layer 28 (short via stub), and the vias for the top corner pair 15 are routed on layer 19.
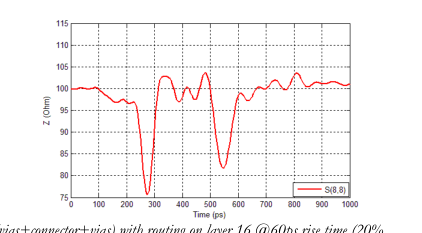
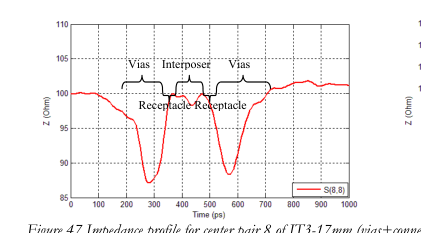
Figure 47 Impedance profile for center pair 8 of IT3-17mm (vias+connector+vias) with routing on layer 16 @60ps rise time (20%
to 80%) and 5.25GHz BW, and @30ps rise time (20% to 80%) and 10.5GHz BW
Page 29
Page 29
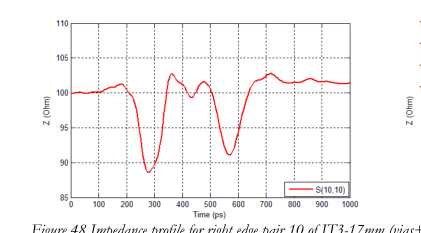
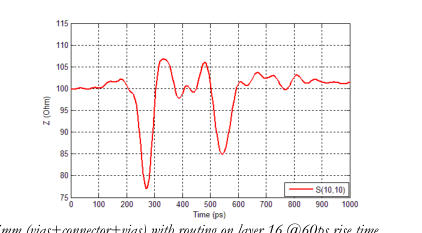
Figure 48 Impedance profile for right edge pair 10 of IT3-17mm (vias+connector+vias) with routing on layer 16 @60ps rise time
(20% to 80%) and 5.25GHz BW, and @30ps rise time (20% to 80%) and 10.5GHz BW
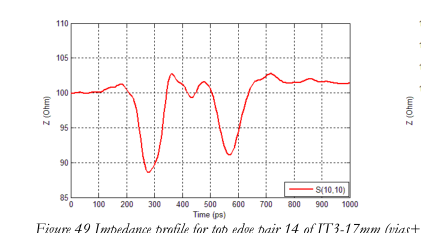
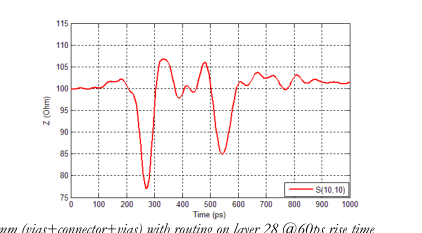
Figure 49 Impedance profile for top edge pair 14 of IT3-17mm (vias+connector+vias) with routing on layer 28 @60ps rise time
(20% to 80%) and 5.25GHz BW, and @30ps rise time (20% to 80%) and 10.5GHz BW
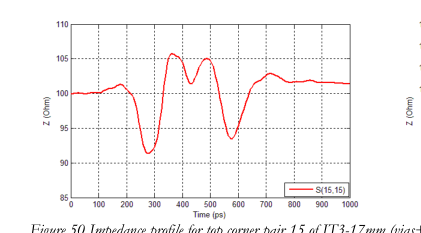
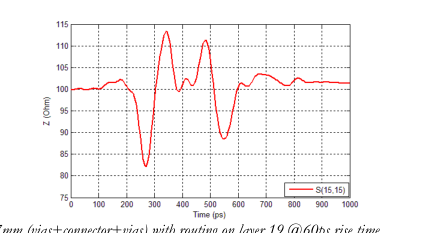
Figure 50 Impedance profile for top corner pair 15 of IT3-17mm (vias+connector+vias) with routing on layer 19 @60ps rise time
(20% to 80%) and 5.25GHz BW, and @30ps rise time (20% to 80%) and 10.5GHz BW
3.2.3 TDR and TDT waveforms (connector only)
3.2.3.1 Fully populated pin assignment
Page 30
Page 30
Figure 51 - Figure 53 show the TDR and TDT waveforms at 30ps, 60ps and 120ps rise times (20% to 80%) for pair 8 of IT3-17mm. The worst cross-talk values to the center pair are summarized in Table 7.
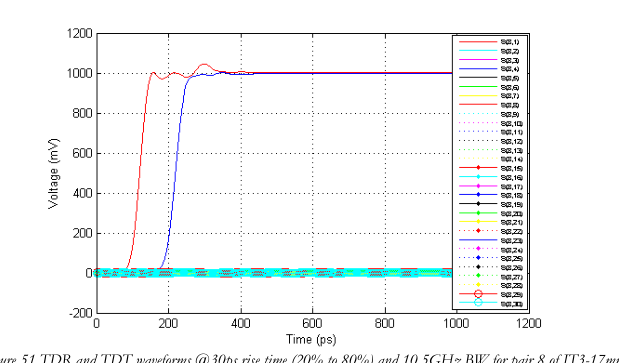
Figure 51 TDR and TDT waveforms @30ps rise time (20% to 80%) and 10.5GHz BW for pair 8 of IT3-17mm
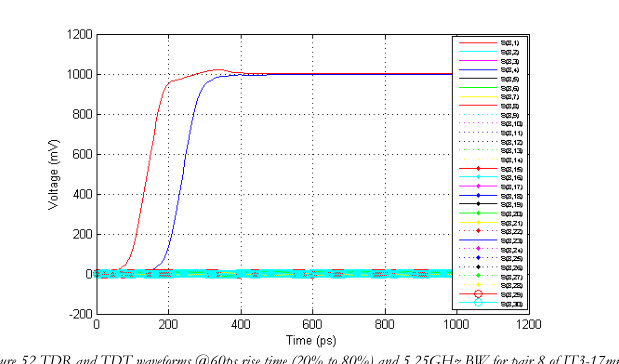
Figure 52 TDR and TDT waveforms @60ps rise time (20% to 80%) and 5.25GHz BW for pair 8 of IT3-17mm
Page 31
Page 31
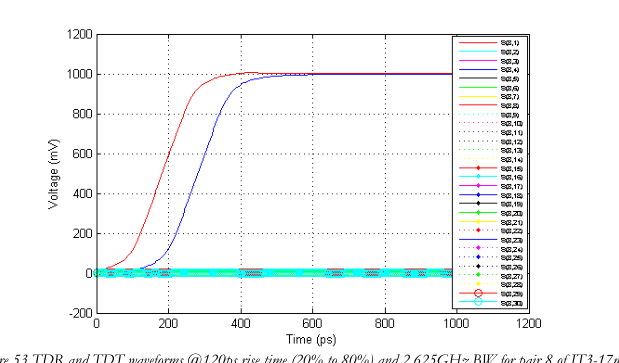
Figure 53 TDR and TDT waveforms @120ps rise time (20% to 80%) and 2.625GHz BW for pair 8 of IT3-17mm
| 20% TO 80% RISE TIME (PS) | WORST PAIR-TO-PAIR NEXT (%) | WORST PAIR-TO-PAIR FEXT (%) |
| 30 | 1.351 | 1.124 |
| 60 | 0.893 | 0.546 |
| 120 | 0.717 | 0.273 |
Table 7 Summary of Time-domain SDD for pair 8 of IT3-17mm
3.2.3.2 60% density pin assignment
Figure 54 - Figure 56 show the TDR and TDT waveforms at 30ps, 60ps and 120ps rise times (20% to 80%) for pair 4 of IT3-17mm for 60% pin density configuration. The worst cross-talk values to the center pair are summarized in Table 8.
Page 32
Page 32
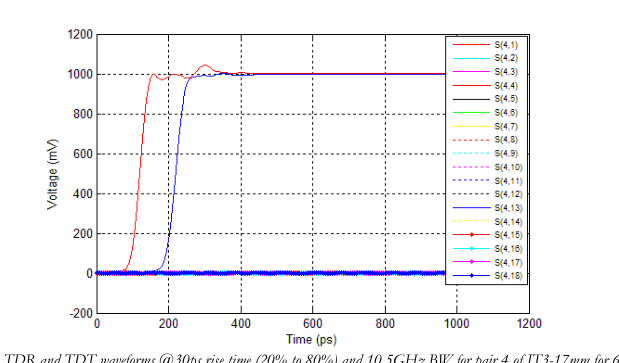
Figure 54 TDR and TDT waveforms @30ps rise time (20% to 80%) and 10.5GHz BW for pair 4 of IT3-17mm for 60% pin
density configuration
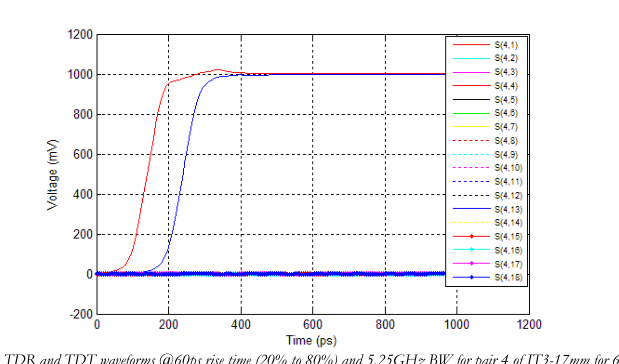
Figure 55 TDR and TDT waveforms @60ps rise time (20% to 80%) and 5.25GHz BW for pair 4 of IT3-17mm for 60% pin
density configuration
Page 33
Page 33
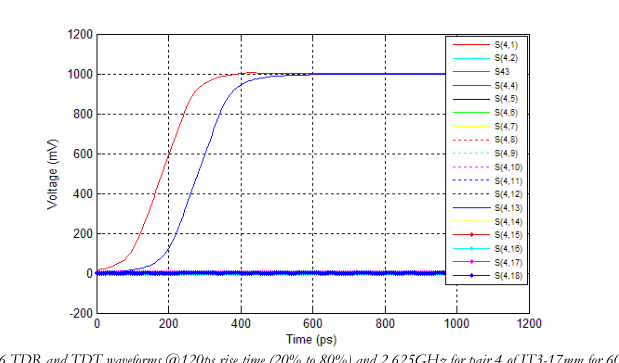
Figure 56 TDR and TDT waveforms @120ps rise time (20% to 80%) and 2.625GHz for pair 4 of IT3-17mm for 60% pin
density configuration
| 20% TO 80% RISE TIME (PS) | WORST PAIR-TO-PAIR NEXT (%) | WORST PAIR-TO-PAIR FEXT (%) |
| 30 | 0.191 | 0.298 |
| 60 | 0.106 | 0.167 |
| 120 | 0.050 | 0.074 |
Table 8 Summary of Time-domain SDD for pair 4 of IT3-17mm for 60% pin density configuration
3.2.3.3 50% density pin assignment
Figure 57 - Figure 59 show the TDR and TDT waveforms at 30ps, 60ps and 120ps rise times (20% to 80%) for pair 4 of IT3-17mm for 50% pin density configuration. The worst cross-talk values to the center pair are summarized in Table 9.
Page 34
Page 34
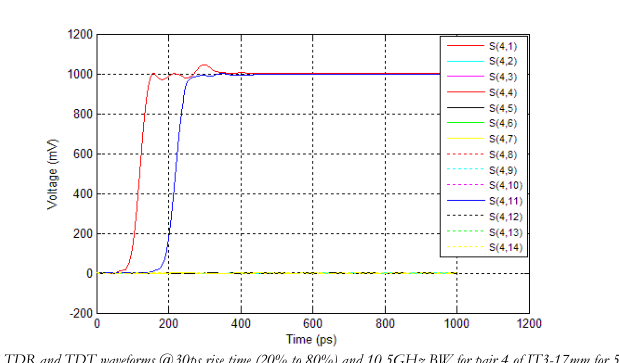
Figure 57 TDR and TDT waveforms @30ps rise time (20% to 80%) and 10.5GHz BW for pair 4 of IT3-17mm for 50% pin
density configuration
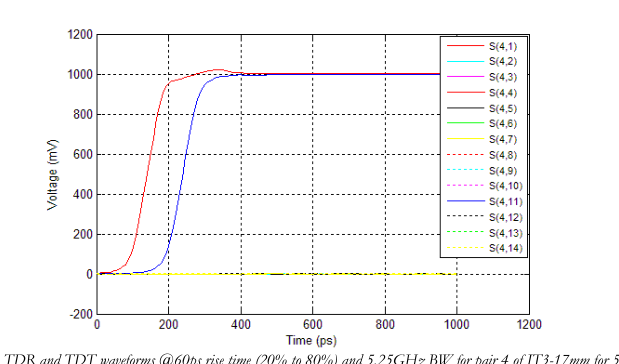
Figure 58 TDR and TDT waveforms @60ps rise time (20% to 80%) and 5.25GHz BW for pair 4 of IT3-17mm for 50% pin
density configuration
Page 35
Page 35
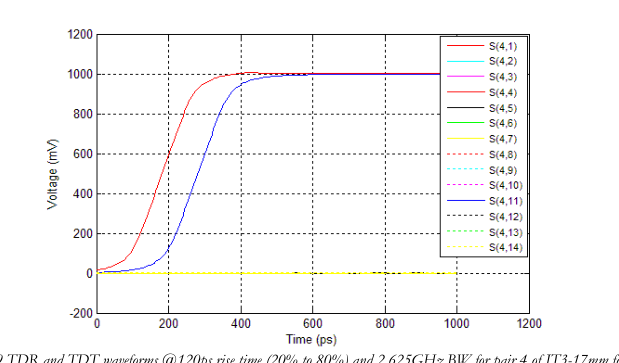
Figure 59 TDR and TDT waveforms @120ps rise time (20% to 80%) and 2.625GHz BW for pair 4 of IT3-17mm for 50%
pin density configuration
| 20% TO 80% RISE TIME (PS) | WORST PAIR-TO-PAIR NEXT (%) | WORST PAIR-TO-PAIR FEXT (%) |
| 30 | 0.090 | 0.145 |
| 60 | 0.049 | 0.084 |
| 120 | 0.026 | 0.042 |
Table 9 Summary of Time-domain SDD for pair 4 of IT3-17mm for 50% pin density configuration
3.2.4 Time-Domain Crosstalk (connector only)
The total differential cross-talk values in % for at 60ps (20% to 80%) rise time and 5.25GHz bandwidth for center pair 8 of the fully populated model and, pair 4 for 60% and 50% pin density are shown in Figure 60, Figure 61 and Figure 62. The outer column (top row as portrait in Figure 60) exhibits higher crosstalk as it is only surrounded by one ground plane.
3.2.4.1 Fully populated pin assignment

Figure 60 Differential cross-talk (in %) from simulations for center pair 8 and step input @ 60ps (20% to 80%) rise time and
5.25GHz BW
Page 36
Page 36
3.2.4.2 60% density pin assignment

Figure 61 Differential cross-talk (in %) from simulations for pair 4 of 60% pin density configuration and step input @ 60ps (20%
to 80%) rise time and 5.25GHz BW
3.2.4.3 50% density pin assignment

Figure 62 Differential cross-talk (in %) from simulations for pair 4 of 50% pin density configuration and step input @ 60ps (20%
to 80%) rise time and 5.25GHz BW
3.2.5 System Voltage and Timing Margins
To demonstrate the IT3’s performance, we ran simulations for the following setup:
Ideal voltage source with package via.
Center pair of the IT3 connector with via transition in the 16th PCB routing layer.
152.4mm (6 inches) PCB trace from driver to IT3 connector, and 152.4mm (6 inches) PCB trace from IT3 connector to receiver, including via transition to the receiver.
The 16th routing layer was chosen to demonstrate that the channel works even with long via stubs of ~60mil, which allows for more design flexibility.
Note: Since the time steps used for the simulations were of 1ps, the timing jitter values have an error margin of 1ps. The eye height is defined as the absolute maximum eye opening.
3.2.5.1 Fully populated pin assignment
The full channel includes package-via models without crosstalk effects at the transmitter and receiver. The following eye diagrams account for these package-via effects, which are not included in the channel model defined in the IEEE 802.3ap spec. For the center-pair channel, the models for package via and connector via are identical (i.e. same via stub length). Table 10, Table 11 and Table 12 show the optimized tap coefficients for the maximum eye opening at various data rates for the channel without the connector and connector vias (Base Case 1), for the channel without the connector only (Base Case 2), and for the full channel.
Page 37
Page 37
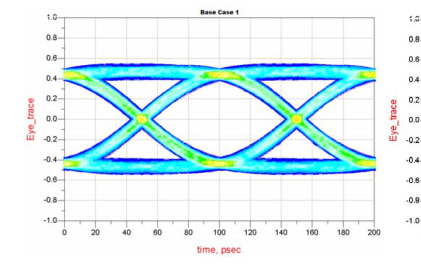
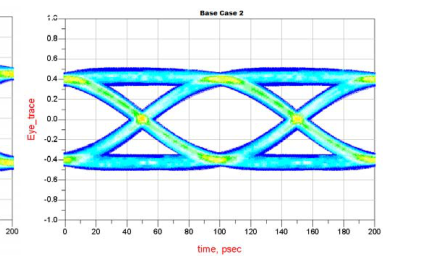
Base Case 1 does not include crosstalk effects and Base Case 2 includes crosstalk of the channel model without the connector. Figure 64 - Figure 66 show the eye diagrams at receiver inputs for various data rates (3.125, 5 6.25 and 10Gbps) with via transition in the 16th PCB routing layer and with 14 FEXT. The full IT3 channel model (raw data with connector), Base Case 1 (data without connector and vias) and Base Case 2 (data without connector only) are portrayed in Figure 63. Table 13 and Table 14 summarize the corresponding results for the eye diagram and their comparison with Base Case 1 and Base Case 2. Column ΔIT3 is the timing jitter or voltage loss
caused by the IT3 connector (with and without vias).
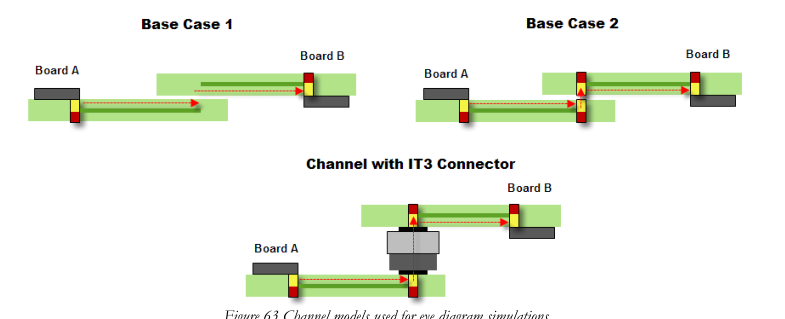
Figure 63 Channel models used for eye diagram simulations
| Data Rate (Gbps) | PRE- CURSOR[1] | MAIN CURSOR | POST- CURSOR[1] |
| 3.125 | ----- | 0.9056 | -0.0944 |
| 5 | ----- | 0.8747 | -0.1253 |
| 6.25 | -0.0359 | 0.8278 | -0.1363 |
| 10 | -0.0694 | 0.7635 | -0.1670 |
Table 10 Base case 1: optimum tap setting coefficients for center pair 8 of IT3-17mm connector
| Data Rate (Gbps) | PRE- CURSOR[1] | MAIN CURSOR | POST- CURSOR[1] |
| 3.125 | ----- | 0.8939 | -0.1061 |
| 5 | ----- | 0.8611 | -0.1389 |
| 6.25 | -0.0435 | 0.8099 | -0.1466 |
| 10 | -0.0826 | 0.7424 | -0.1751 |
Table 11 Base case 2: optimum tap setting coefficients for center pair 8 of IT3-17mm connector
Page 38
Page 38
| Data Rate (Gbps) | PRE- CURSOR[1] | MAIN CURSOR | POST- CURSOR[1] |
| 3.125 | ----- | 0.8961 | -0.1039 |
| 5 | ----- | 0.8629 | -0.1371 |
| 6.25 | -0.0468 | 0.8047 | -0.1484 |
| 10 | -0.0929 | 0.7311 | -0.1760 |
Table 12 Full channel: optimum tap setting coefficients for center pair 8 of IT3-17mm connector
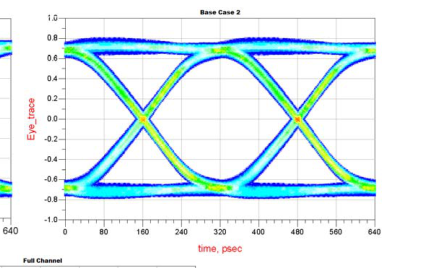
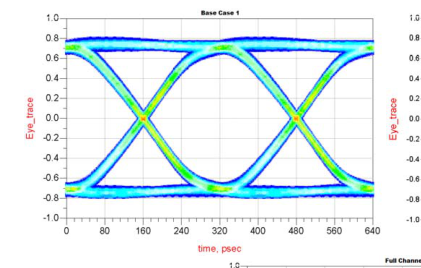
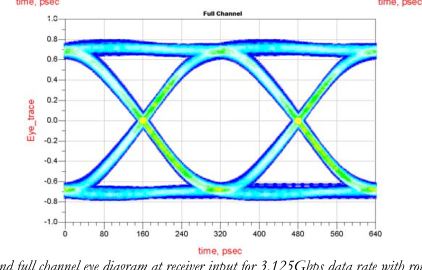
Figure 64 Base case 1, 2 and full channel eye diagram at receiver input for 3.125Gbps data rate with routing on layer 16 and 14
FEXT
Page 39
Page 39
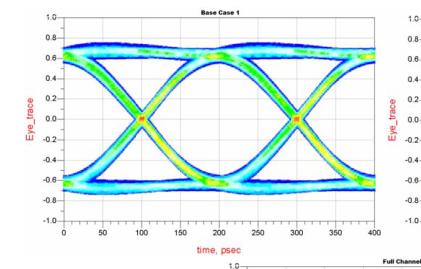
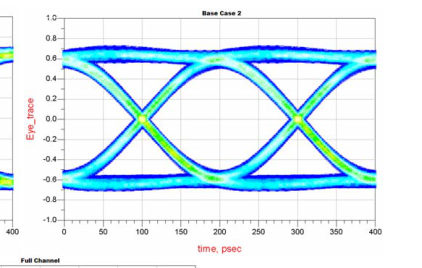
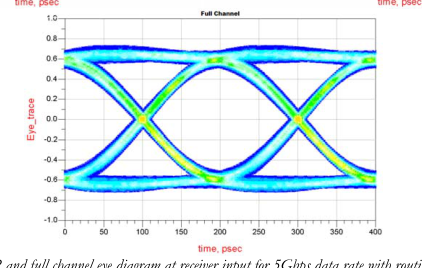
Figure 65 Base case 1, 2 and full channel eye diagram at receiver input for 5Gbps data rate with routing on layer 16 and 14
FEXT
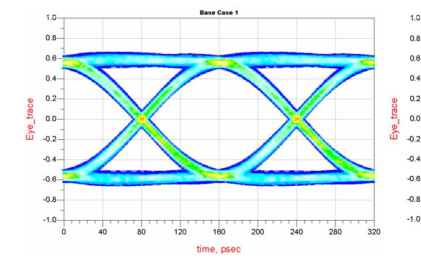
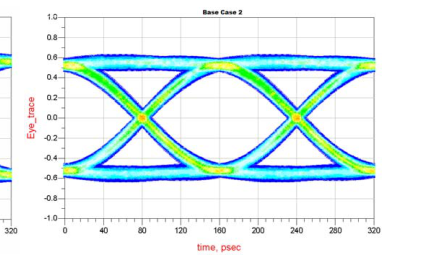
Page 40
Page 40
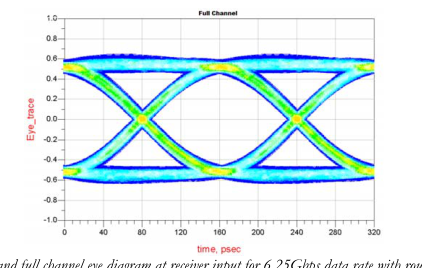
Figure 66 Base case 1, 2 and full channel eye diagram at receiver input for 6.25Gbps data rate with routing on layer 16 and 14
FEXT
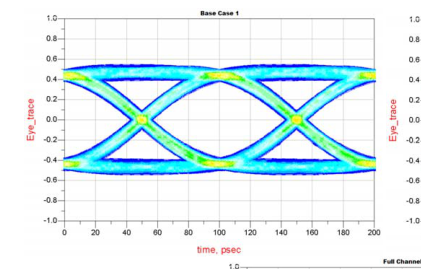
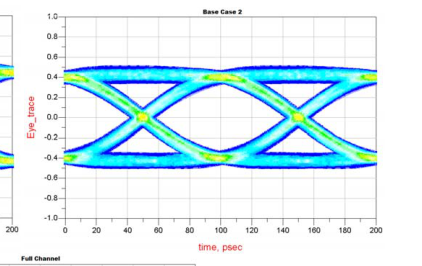
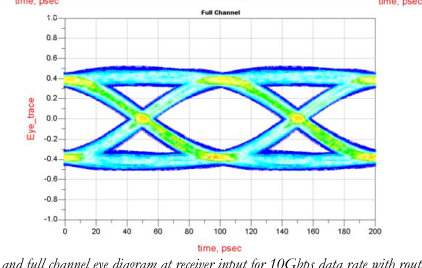
Figure 67 Base case 1, 2 and full channel eye diagram at receiver input for 10Gbps data rate with routing on layer 16 and 14
FEXT
Page 41
Page 41
| Data Rate (Gbps) | Timing Jitter (ps) | Eye Height (mV) | ||||||
|---|---|---|---|---|---|---|---|---|
| IT3 | Base Case 1 | ΔIT3 | ΔIT3 (%) | IT3 | Base Case 1 | ΔIT3 | ΔIT3 (%) | |
| 3.125 | 20.21 | 15.08 | 5.13 | 1.60 | 1248.86 | 1314.30 | -65.44 | -4.98 |
| 5 | 17.17 | 11.80 | 5.37 | 2.69 | 1044.57 | 1131.88 | -87.31 | -7.71 |
| 6.25 | 14.82 | 11.64 | 3.18 | 1.99 | 927.44 | 1024.59 | -97.15 | -9.48 |
| 10 | 15.1 | 10.69 | 4.41 | 4.41 | 646.06 | 773.19 | -127.13 | -16.44 |
Table 13 Comparison of eye height and timing fuzz between full channel and Base Case 1 at the receiver’s input with 14 FEXT
| Data Rate (Gbps) | Timing Jitter (ps) | Eye Height (mV) | ||||||
|---|---|---|---|---|---|---|---|---|
| IT3 | Base Case 2 | ΔIT3 | ΔIT3 (%) | IT3 | Base Case 2 | ΔIT3 | ΔIT3 (%) | |
| 3.125 | 20.21 | 20.00 | 0.21 | 0.07 | 1248.86 | 1243.00 | 5.86 | 0.47 |
| 5 | 17.17 | 14.81 | 2.36 | 1.18 | 1044.57 | 1042.36 | 2.21 | 0.21 |
| 6.25 | 14.82 | 14.65 | 0.17 | 0.11 | 927.44 | 940.69 | -13.25 | -1.41 |
| 10 | 15.1 | 12.46 | 2.64 | 2.64 | 646.06 | 686.70 | -40.64 | -5.92 |
Table 14 Comparison of eye height and timing fuzz between full channel and Base Case 2 at the receiver’s input with 14 FEXT
3.2.5.2 50% density pin assignment
Figure 25, Figure 26 and Figure 27 show the optimized tap coefficients for the maximum eye
opening at various data rates for the channel without the connector and connector vias (Base Case 1), for the channel without the connector only (Base Case 2), and for the full channel.
Figure 68 - Figure 72 show the eye diagrams at receiver inputs for various data rates (5, 6.25, 10
12.5 and 20Gbps) with via transition in the 16th PCB routing layer and with 6 FEXT.
Table 18 and Table 19 summarize the corresponding results for the eye diagram and their
comparison with Base Case 1 and Base Case 2.
| Data Rate (Gbps) | PRE- CURSOR[3] | PRE- CURSOR[2] | PRE- CURSOR[1] | MAIN CURSOR | POST- CURSOR[1] | POST- CURSOR[2] | POST- CURSOR[3] |
| 5 | ----- | ----- | ----- | 0.8747 | -0.1253 | ----- | ----- |
| 6.25 | ----- | ----- | -0.0359 | 0.8278 | -0.1363 | ----- | ----- |
| 10 | ----- | ----- | -0.0694 | 0.7635 | -0.1670 | ----- | ----- |
| 12.5 | ----- | ----- | -0.0967 | 0.7207 | -0.1827 | ----- | ----- |
| 20 | ----- | 0.0297 | -0.1562 | 0.6129 | -0.1839 | -0.0174 | ----- |
Table 15 Base case 1: optimum tap setting coefficients for center pair 4 of IT3-17mm connector for 50% pin density configuration
| Data Rate (Gbps) | PRE- CURSOR[3] | PRE- CURSOR[2] | PRE- CURSOR[1] | MAIN CURSOR | POST- CURSOR[1] | POST- CURSOR[2] | POST- CURSOR[3] |
| 5 | ----- | ----- | ----- | 0.8611 | -0.1389 | ----- | ----- |
| 6.25 | ----- | ----- | -0.0435 | 0.8099 | -0.1466 | ----- | ----- |
| 10 | ----- | ----- | -0.0826 | 0.7424 | -0.1751 | ----- | ----- |
| 12.5 | ----- | ----- | -0.1216 | 0.6997 | -0.1788 | ----- | ----- |
| 20 | -0.0170 | 0.0521 | -0.1888 | 0.5552 | -0.1699 | -0.0170 | ----- |
Table 16 Base case 2: optimum tap setting coefficients for center pair 4 of IT3-17mm connector for 50% pin density configuration
Page 42
Page 42
| Data Rate (Gbps) | PRE- CURSOR[3] | PRE- CURSOR[2] | PRE- CURSOR[1] | MAIN CURSOR | POST- CURSOR[1] | POST- CURSOR[2] | POST- CURSOR[3] |
| 5 | ----- | ----- | ----- | 0.8629 | -0.1371 | ----- | ----- |
| 6.25 | ----- | ----- | -0.0468 | 0.8047 | -0.1484 | ----- | ----- |
| 10 | ----- | ----- | -0.0929 | 0.7311 | -0.1760 | ----- | ----- |
| 12.5 | ----- | ----- | -0.1267 | 0.6753 | -0.1980 | ----- | ----- |
| 20 | ----- | 0.0483 | -0.1854 | 0.5454 | -0.2208 | ----- | ----- |
Table 17 Full channel: optimum tap setting coefficients for center pair 4 of IT3-17mm connector for 50% pin density configuration
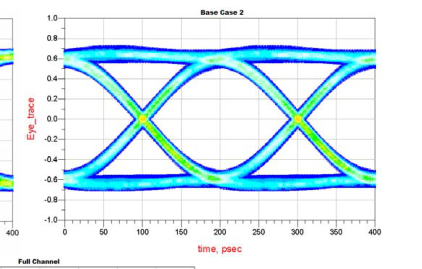
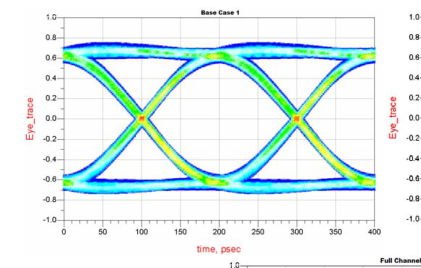
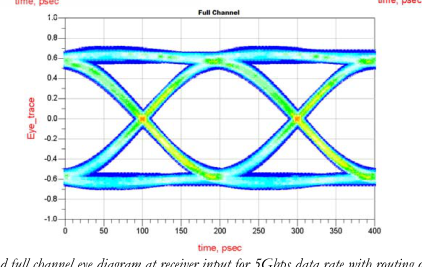
Figure 68 Base case 1, 2 and full channel eye diagram at receiver input for 5Gbps data rate with routing on layer 16 and 6 FEXT
for 50% pin density configuration
Page 43
Page 43
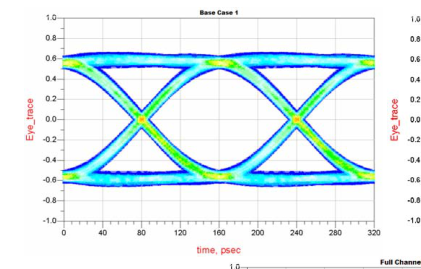
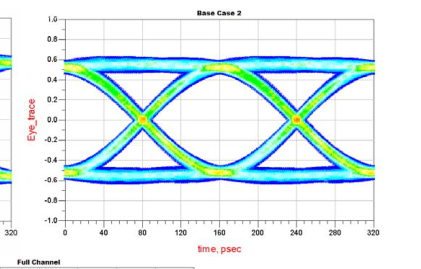
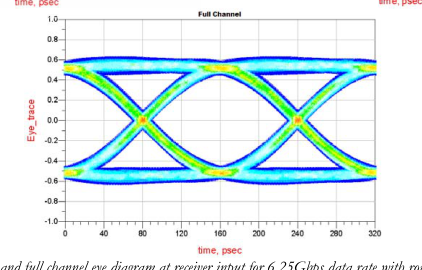
Figure 69 Base case 1, 2 and full channel eye diagram at receiver input for 6.25Gbps data rate with routing on layer 16 and 6
FEXT for 50% pin density configuration
Page 44
Page 44
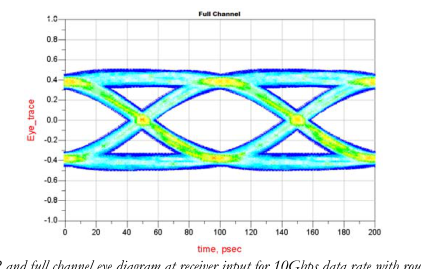
Figure 70 Base case 1, 2 and full channel eye diagram at receiver input for 10Gbps data rate with routing on layer 16 and 6
FEXT for 50% pin density configuration
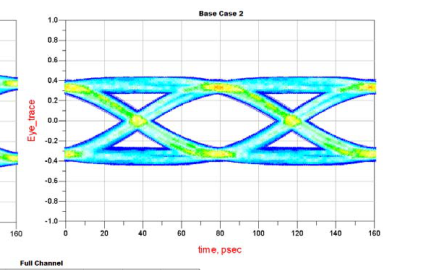
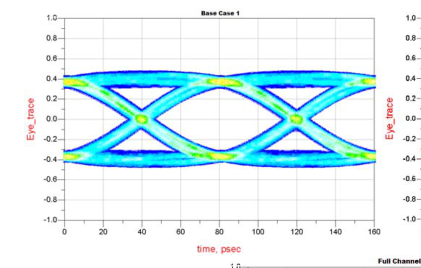
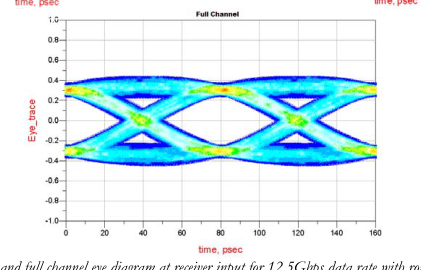
Figure 71 Base case 1, 2 and full channel eye diagram at receiver input for 12.5Gbps data rate with routing on layer 16 and 6
FEXT for 50% pin density configuration
Page 45
Page 45
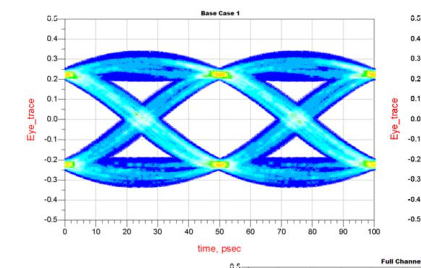
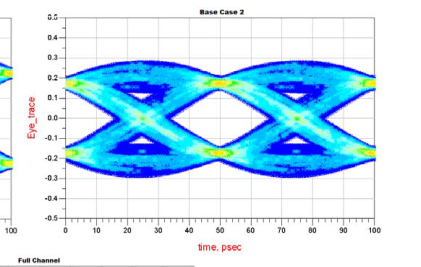
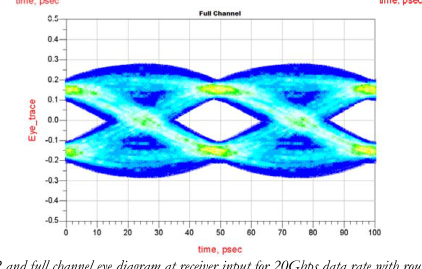
Figure 72 Base case 1, 2 and full channel eye diagram at receiver input for 20Gbps data rate with routing on layer 16 and 6
FEXT for 50% pin density configuration
| Data Rate (Gbps) | Timing Jitter (ps) | Eye Height (mV) | ||||||
|---|---|---|---|---|---|---|---|---|
| IT3 | Base Case 1 | ΔIT3 | ΔIT3 (%) | IT3 | Base Case 1 | ΔIT3 | ΔIT3 (%) | |
| 5 | 14.80 | 11.80 | 3.00 | 1.50 | 1044.41 | 1131.88 | -87.47 | -7.73 |
| 6.25 | 15.25 | 11.64 | 3.61 | 2.26 | 922.96 | 1024.59 | -101.63 | -9.92 |
| 10 | 14.51 | 10.69 | 3.82 | 3.82 | 649.82 | 773.19 | -123.37 | -15.96 |
| 12.5 | 19.28 | 11.26 | 8.02 | 10.03 | 508.79 | 639.75 | -130.96 | -20.47 |
| 20 | 19.73 | 11.78 | 7.95 | 15.90 | 225.30 | 403.74 | -178.44 | -44.20 |
Table 18 Comparison of eye height and timing fuzz between full channel and Base Case 1 at the receiver’s input with 6 FEXT for
50% pin density configuration
| Data Rate (Gbps) | Timing Jitter (ps) | Eye Height (mV) | ||||||
|---|---|---|---|---|---|---|---|---|
| IT3 | Base Case 2 | ΔIT3 | ΔIT3 (%) | IT3 | Base Case 2 | ΔIT3 | ΔIT3 (%) | |
| 5 | 14.80 | 14.80 | 0.00 | 0.00 | 1044.41 | 1042.45 | 1.96 | 0.19 |
| 6.25 | 15.25 | 14.61 | 0.64 | 0.40 | 922.96 | 939.36 | -16.40 | -1.75 |
| 10 | 14.51 | 12.47 | 2.04 | 2.04 | 649.82 | 689.11 | -39.29 | -5.70 |
| 12.5 | 19.28 | 13.84 | 5.44 | 6.80 | 508.79 | 559.63 | -50.84 | -9.08 |
| 20 | 19.73 | 15.91 | 3.82 | 7.64 | 225.30 | 296.02 | -70.72 | -23.89 |
Table 19 Comparison of eye height and timing fuzz between full channel and Base Case 2 at the receiver’s input with 6 FEXT for
50% pin density configuration
Page 46
Page 46
4. Single-ended Signals
4.1 Frequency-Domain Modeling
4.1.1 S parameters (connector only)
A 60-port single-ended Touchstone file was used as described in Section 3.1.1. The single-ended pin assignment is shown in Figure 73. For our analyses, we consider ports 3-27 and ports 33-57. Figure 74 shows the corresponding S-parameters for port 15, where the insertion loss (IL), return loss (RL), and crosstalk can be clearly seen, and are summarized in Table 20. Impedance and trace delay values for each of the 30 single-ended traces are shown in Table 21. Figure 75 and Figure 76 show the absolute sum of near-end and far-end crosstalk, respectively.

Figure 73 Single-ended pin assignment
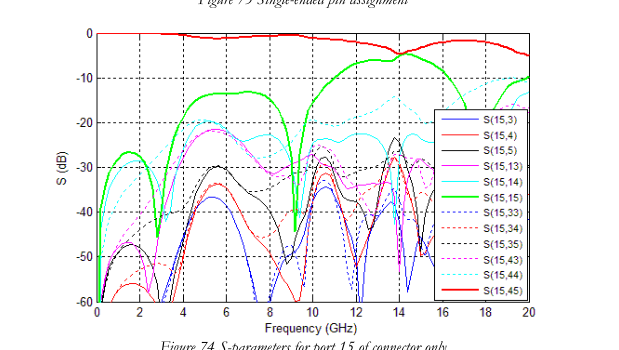
Figure 74 S-parameters for port 15 of connector only
| FREQUENCY (MHZ) | INSERTION LOSS (DB) | RETURN LOSS (DB) | WORST PAIR-TO-PAIR NEXT (DB) | WORST PAIR-TO-PAIR FEXT (DB) |
| 400 | -0.045 | -34.12 | -37.98 | -44.92 |
| 533 | -0.055 | -32.06 | -35.63 | -42.54 |
| 800 | -0.075 | -29.32 | -32.51 | -39.23 |
Table 20 Summary of S-parameters for port 15 of connector only
Page 47
Page 47
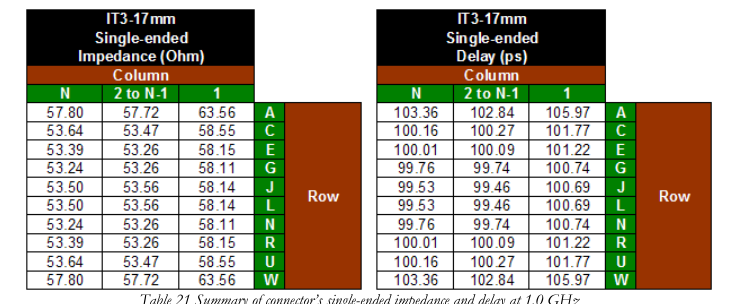
Table 21 Summary of connector’s single-ended impedance and delay at 1.0 GHz
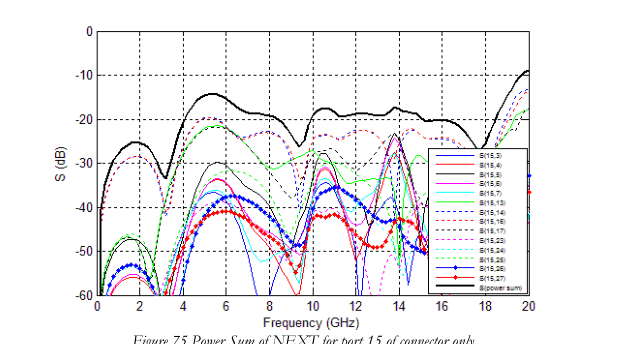
Figure 75 Power Sum of NEXT for port 15 of connector only
Page 48
Page 48
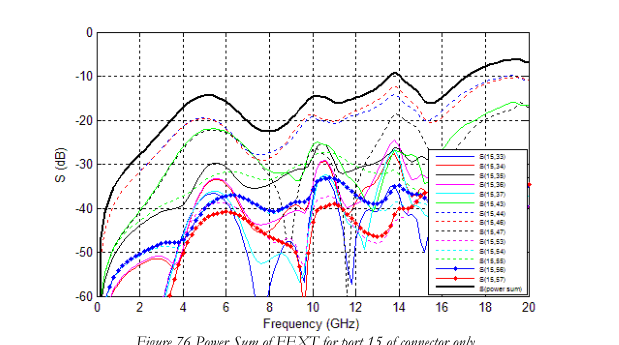
Figure 76 Power Sum of FEXT for port 15 of connector only
4.1.2 S parameters (vias only)
Figure 77 shows the single-ended via model S-parameters of port 15, as described in Section 3.1.2.
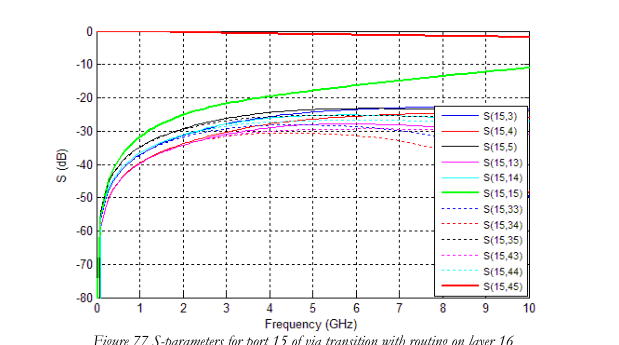
Figure 77 S-parameters for port 15 of via transition with routing on layer 16
4.1.3 S parameters (vias + connector + vias)
Figure 78 shows the S-parameters (i.e., insertion loss, return loss, NEXT, and FEXT) for port 15 of the cascaded vias/connector/vias model with PCB routing in the 16th layer for both via
Page 49
Page 49
transitions. All PCB traces coming out from the vias have been matched to 10.507mm. The results at various frequencies of interest are summarized in Table 22.
Figure 79 and Figure 80 show the power sum of NEXT and FEXT for the cascaded model (vias
+ connector + vias) of the single-ended center port.
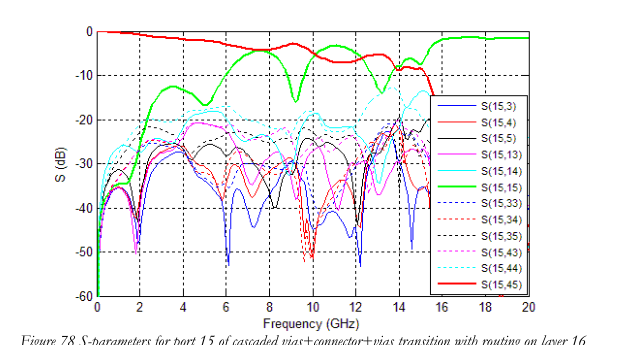
Figure 78 S-parameters for port 15 of cascaded vias+connector+vias transition with routing on layer 16
| FREQUENCY (GHZ) | INSERTION LOSS (DB) | RETURN LOSS (DB) | WORST PAIR-TO-PAIR NEXT (DB) | WORST PAIR-TO-PAIR FEXT (DB) |
| 400 | -0.178 | -38.10 | -28.35 | -33.14 |
| 533 | -0.228 | -36.82 | -26.51 | -30.95 |
| 800 | -0.323 | -35.14 | -24.76 | -27.95 |
Table 22 Summary of S-parameters for port 15 of cascaded vias+connector+vias transition with routing on layer 16
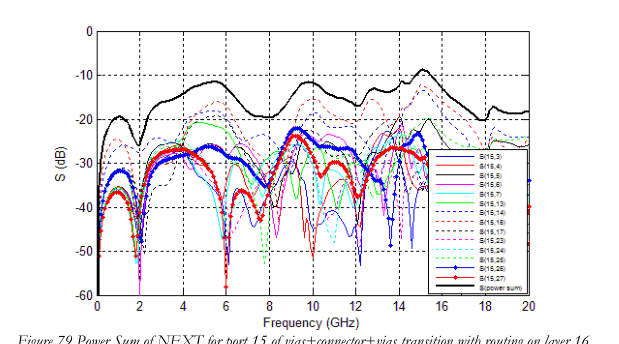
Figure 79 Power Sum of NEXT for port 15 of vias+connector+vias transition with routing on layer 16
Page 50
Page 50
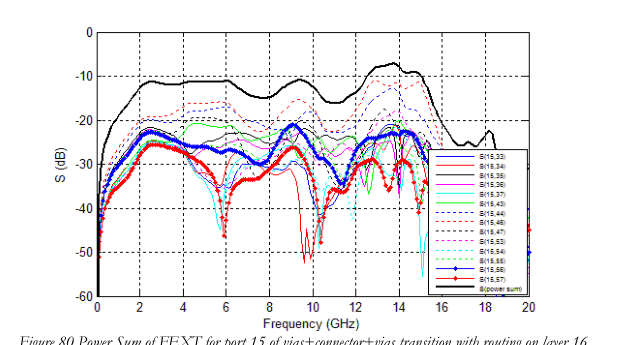
Figure 80 Power Sum of FEXT for port 15 of vias+connector+vias transition with routing on layer 16
4.1.4 W-element Model (PCB trace)
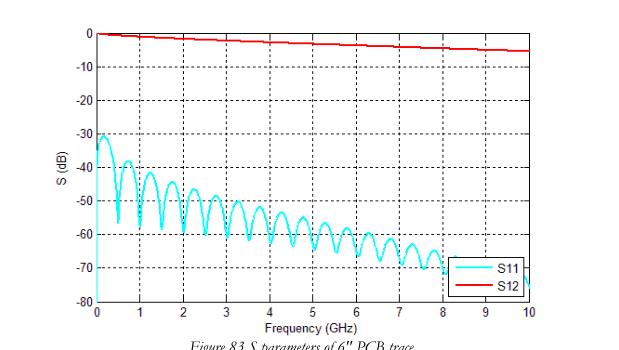
The signal traces in the PCB follow the cross section in Figure 81 for 50 Ohms single-ended impedance. The corresponding W-element model and S parameters are shown in Figure 82 and Figure 83.
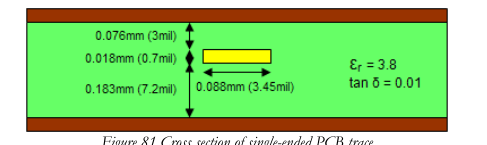
Figure 81 Cross section of single-ended PCB trace
Page 51
Page 51
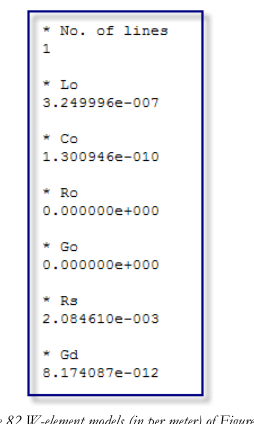
Figure 82 W-element models (in per meter) of Figure 81
Page 52
Page 52
4.2 Time-Domain Simulation
4.2.1 Impedance Profile (connector only)
The impedance profiles for center port 15, right edge port 20, top edge port 29, and top corner port 30, as portrayed in Figure 84, are shown in Figure 85, Figure 86, Figure 87 and Figure 88.
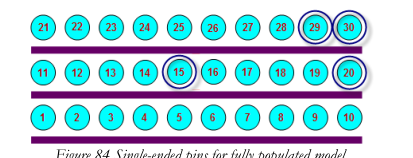
Figure 84 Single-ended pins for fully populated model
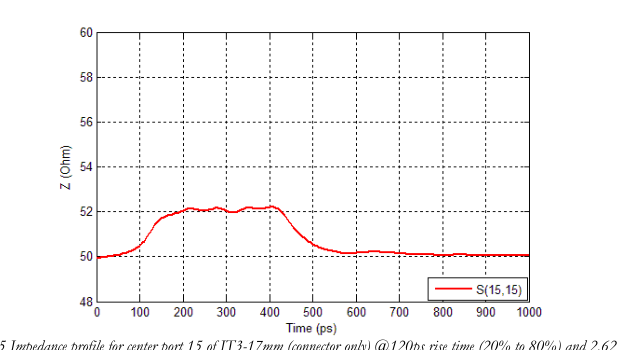
Figure 85 Impedance profile for center port 15 of IT3-17mm (connector only) @120ps rise time (20% to 80%) and 2.625GHz
BW
Page 53
Page 53
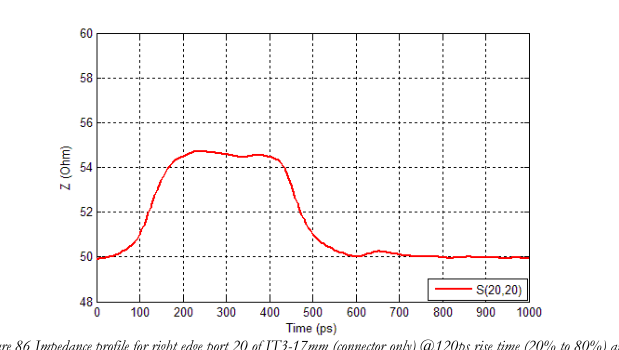
Figure 86 Impedance profile for right edge port 20 of IT3-17mm (connector only) @120ps rise time (20% to 80%) and
2.625GHz BW
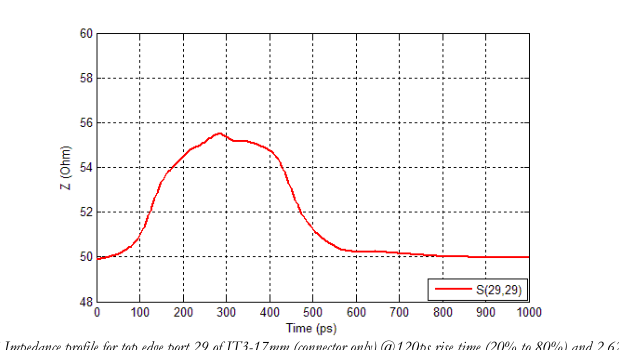
Figure 87 Impedance profile for top edge port 29 of IT3-17mm (connector only) @120ps rise time (20% to 80%) and 2.625GHz
BW
Page 54
Page 54
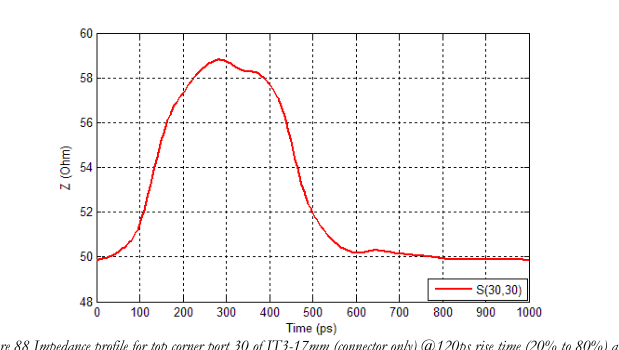
Figure 88 Impedance profile for top corner port 30 of IT3-17mm (connector only) @120ps rise time (20% to 80%) and
2.625GHz BW
4.2.2 Impedance Profile (via + connector + via)
The impedance profiles for center port 15, right edge port 20, top edge port 29, and top corner port 30 of the fully populated model (via + connector + via) as portrayed in Figure 84, are shown in Figure 89, Figure 90, Figure 91 and Figure 92. The via model for center port 15 and right edge port 20 are routed on layer 16, and the top edge port 29 and top corner port 30 vias are routed on layer 19. Since the same differential via models were used for our single-ended model analysis, each via will have additional coupling from an adjacent via with routing on the same layer.
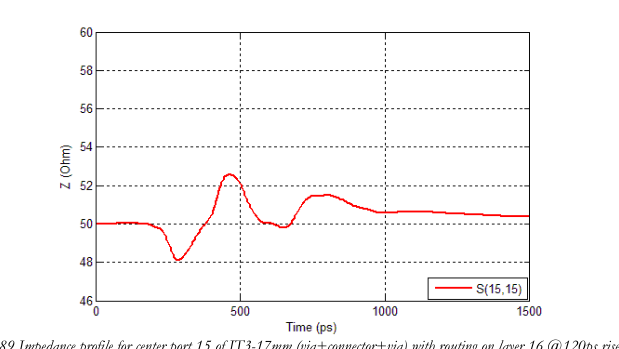
Figure 89 Impedance profile for center port 15 of IT3-17mm (via+connector+via) with routing on layer 16 @120ps rise time
(20% to 80%) and 2.625GHz BW
Page 55
Page 55
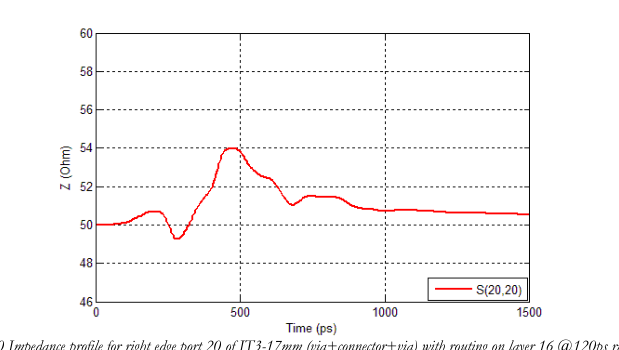
Figure 90 Impedance profile for right edge port 20 of IT3-17mm (via+connector+via) with routing on layer 16 @120ps rise time
(20% to 80%) and 2.625GHz BW
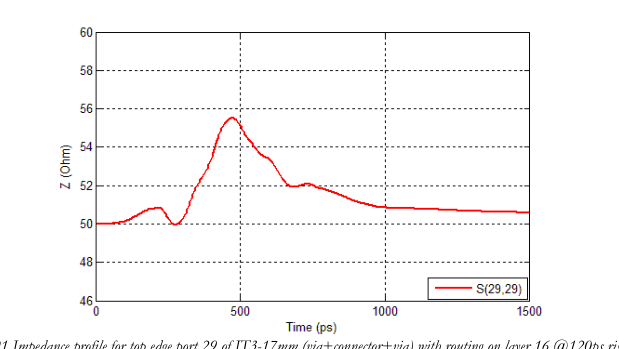
Figure 91 Impedance profile for top edge port 29 of IT3-17mm (via+connector+via) with routing on layer 16 @120ps rise time
(20% to 80%) and 2.625GHz BW
Page 56
Page 56
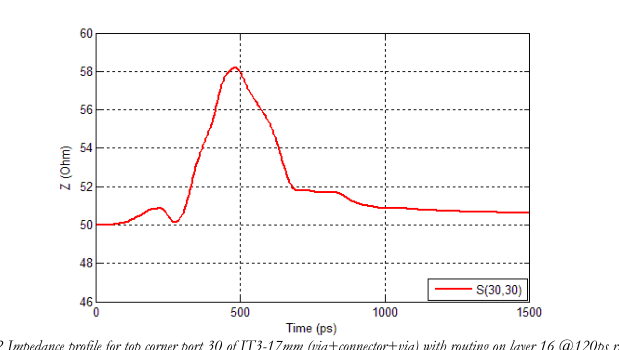
Figure 92 Impedance profile for top corner port 30 of IT3-17mm (via+connector+via) with routing on layer 16 @120ps rise time
(20% to 80%) and 2.625GHz BW
4.2.3 TDR and TDT waveforms (connector only)
Figure 93 - Figure 95 show the TDR and TDT waveforms at 120ps and 150ps and 180ps rise times (20% to 80%) for port 15 of IT3-17mm. The worst cross-talk values to the center port are summarized in Table 23.
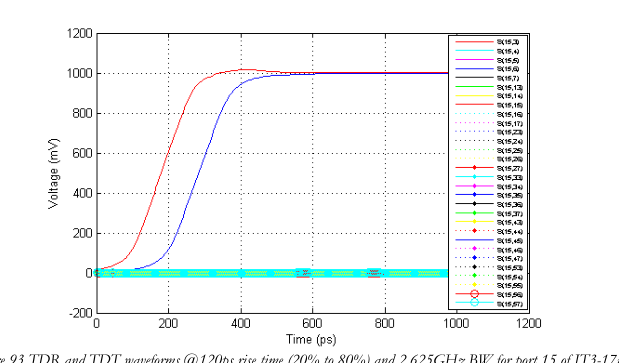
Figure 93 TDR and TDT waveforms @120ps rise time (20% to 80%) and 2.625GHz BW for port 15 of IT3-17mm
Page 57
Page 57
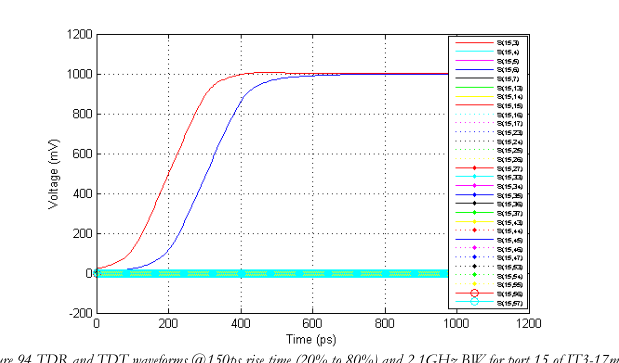
Figure 94 TDR and TDT waveforms @150ps rise time (20% to 80%) and 2.1GHz BW for port 15 of IT3-17mm
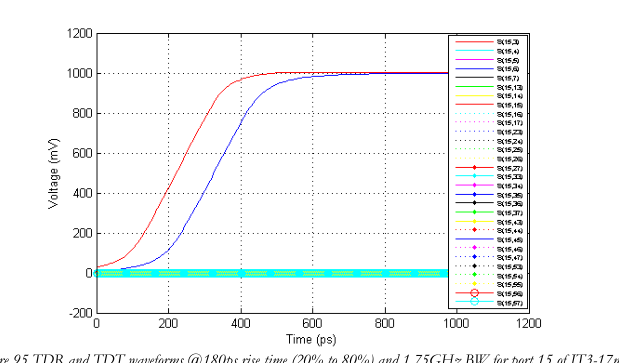
Figure 95 TDR and TDT waveforms @180ps rise time (20% to 80%) and 1.75GHz BW for port 15 of IT3-17mm
| 20% TO 80% RISE TIME (PS) | WORST PAIR-TO-PAIR NEXT (%) | WORST PAIR-TO-PAIR FEXT (%) |
| 120 | 1.752 | 1.268 |
| 150 | 1.668 | 0.989 |
| 180 | 1.558 | 0.805 |
Table 23 Summary of Time-domain cross-talk for port 15 of IT3-17mm
Page 58
Page 58
4.2.4 Time-Domain Crosstalk (connector only)
The total single-ended cross-talk values in % at 120ps (20% to 80%) rise time and 2.625GHz bandwidth for port 15 is shown in Figure 96.

Figure 96 Single-ended cross-talk (in %) from simulations for port 15 and step input @ 120ps (20% to 80%) rise time and
2.625GHz BW
4.2.5 System Voltage and Timing Margins
To demonstrate the IT3’s performance for single-ended signals, we ran simulations for the following setup:
Ideal voltage source with package via.
Center pin of IT3 connector with via transition in the 16th PCB routing layer.
152.4mm (6 inches) PCB trace from driver to IT3 connector, and 152.4mm (6 inches) PCB trace from IT3 connector to receiver, including via transition to the receiver.
Note: Since the time steps used for the simulations were of 1ps, the timing jitter values have an error margin of 1ps. The eye height is defined as the absolute maximum eye opening.
Page 59
Page 59
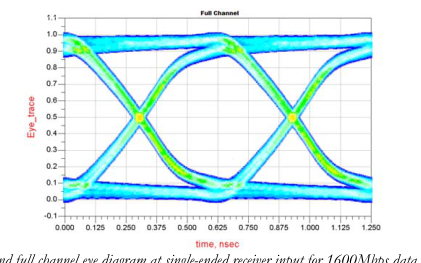
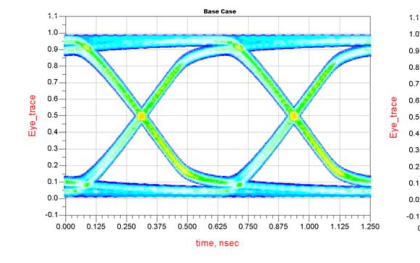
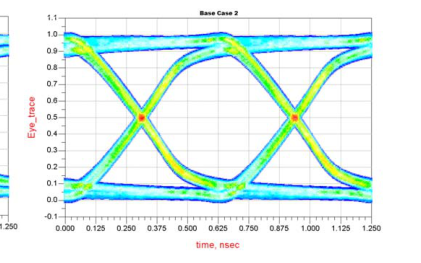
Figure 97 Base case 1, 2 and full channel eye diagram at single-ended receiver input for 1600Mbps data rate with routing on layer
16 and 14 FEXT
| Data Rate (Mbps) | Timing Jitter (ps) | Eye Height (mV) | ||||||
|---|---|---|---|---|---|---|---|---|
| IT3 | Base Case 1 | ΔIT3 | ΔIT3 (%) | IT3 | Base Case 1 | ΔIT3 | ΔIT3 (%) | |
| 1600 | 37.34 | 34.51 | 2.83 | 0.45 | 764.41 | 748.68 | 15.73 | 2.10 |
Table 24 Comparison of eye height and timing fuzz between single-ended full channel and Base Case 1 at the receiver’s input with 14
FEXT
| Data Rate (Mbps) | Timing Jitter (ps) | Eye Height (mV) | ||||||
|---|---|---|---|---|---|---|---|---|
| IT3 | Base Case 2 | ΔIT3 | ΔIT3 (%) | IT3 | Base Case 2 | ΔIT3 | ΔIT3 (%) | |
| 1600 | 37.34 | 35.86 | 1.48 | 0.24 | 764.41 | 768.11 | -3.70 | -0.48 |
Table 25 Comparison of eye height and timing fuzz between single-ended full channel and Base Case 2 at the receiver’s input with 14
FEXT
Page 60
Page 60
5. Measurement
5.1 Measurement Setup
To measure the connector’s performance directly we pre-characterized and de-embedded the test boards to eliminate the effects of SMAs, traces and vias. The characterization boards were designed to have minimal effect on the connector’s performance. The traces have controlled impedance of 50Ω and coplanar traces were used to minimize the crosstalk from trace to trace. Please refer to the document IT3_Characterization_Board_v09.doc for more details about the characterization board for IT3. The measurement setup is shown in Figure 98.
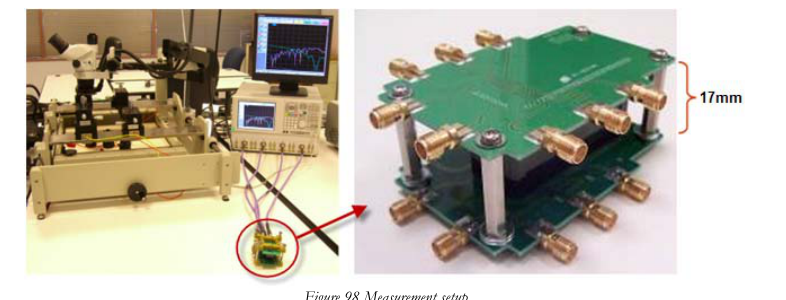
Figure 98 Measurement setup
IT3-17mm was also tested in a 12” channel with 120mil FR408 board, mid-layer routing, and 8- aggressor cross-talk, as shown in Figure 99. Please refer to the document IT3_demo_board_v2.doc for more details about the demo board for IT3.
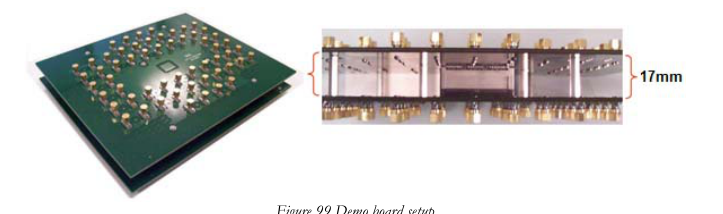
Figure 99 Demo board setup
Page 61
Page 61
5.2 Differential Signals
5.2.1 Measurement vs. Simulation Correlation (connector only)
Figure 101 and Figure 102 show the measurement vs. simulation correlation of insertion loss (IL), return loss (RL) and differential S parameters (SDD) between two nearest neighboring pairs for the center differential pair 8 (as shown in Figure 100). Good correlation was observed for all IL, RL, near-end cross-talk (NEXT), and far-end cross-talk (FEXT).
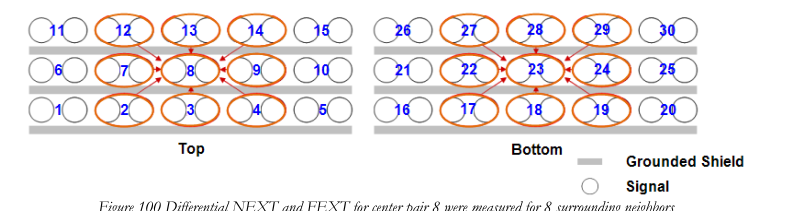
Figure 100 Differential NEXT and FEXT for center pair 8 were measured for 8 surrounding neighbors
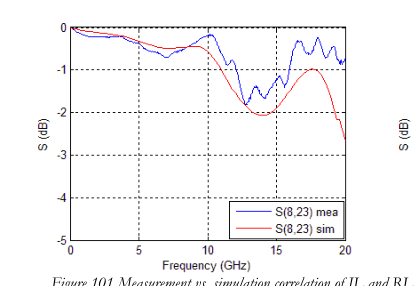
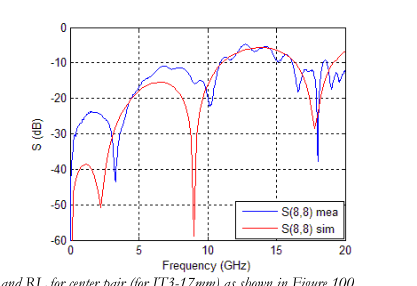
Figure 101 Measurement vs. simulation correlation of IL and RL for center pair (for IT3-17mm) as shown in Figure 100
Page 62
Page 62
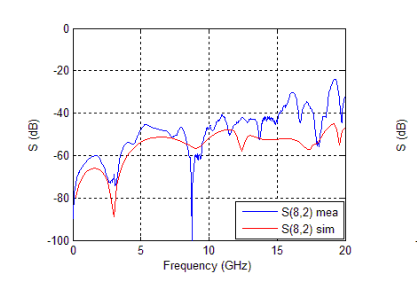
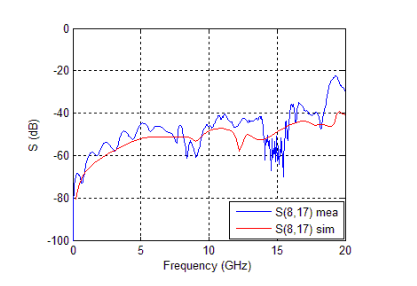
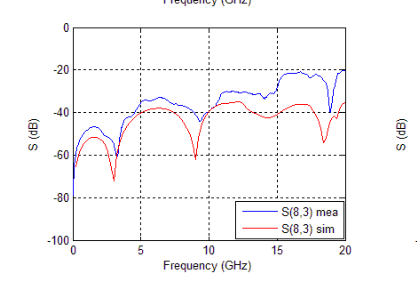
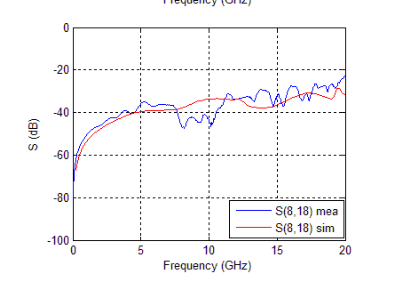
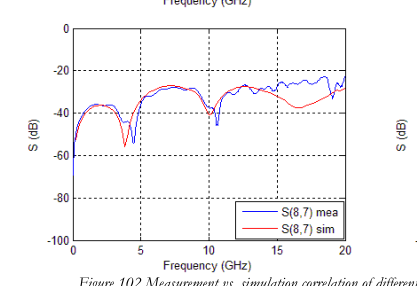
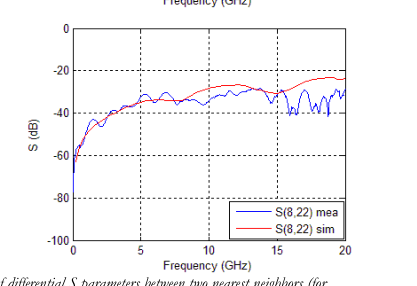
Figure 102 Measurement vs. simulation correlation of differential S parameters between two nearest neighbors (for
IT3-17mm) as shown in Figure 100
Page 63
Page 63
Cross-talk power sum, ICR profile and RL profile were plotted from DC to 20GHz and compared to the IEEE 802.3ap spec.
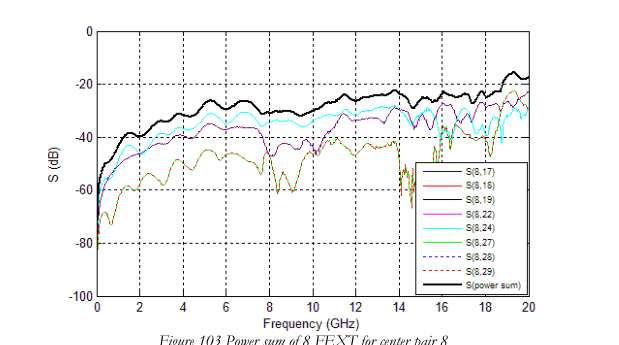
Figure 103 Power sum of 8 FEXT for center pair 8
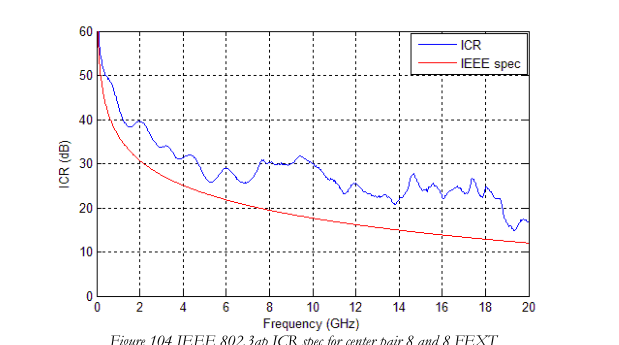
Figure 104 IEEE 802.3ap ICR spec for center pair 8 and 8 FEXT
Page 64
Page 64
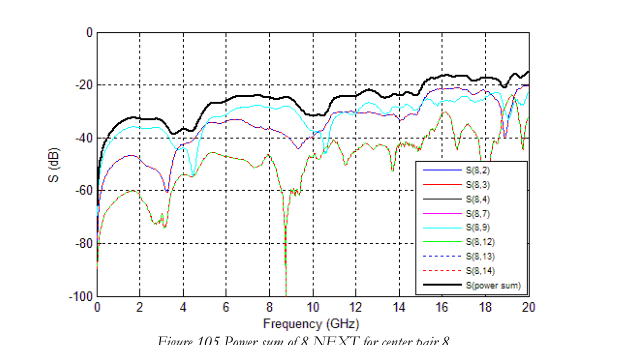
Figure 105 Power sum of 8 NEXT for center pair 8
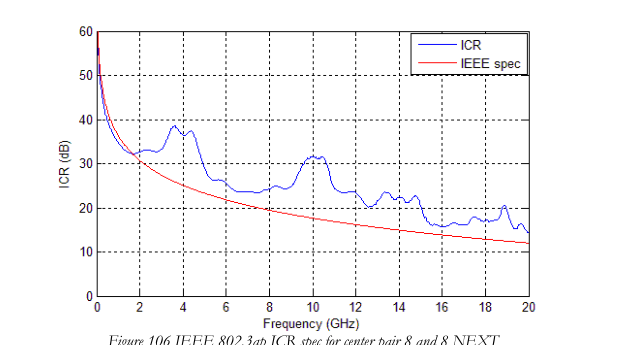
Figure 106 IEEE 802.3ap ICR spec for center pair 8 and 8 NEXT
Page 65
Page 65
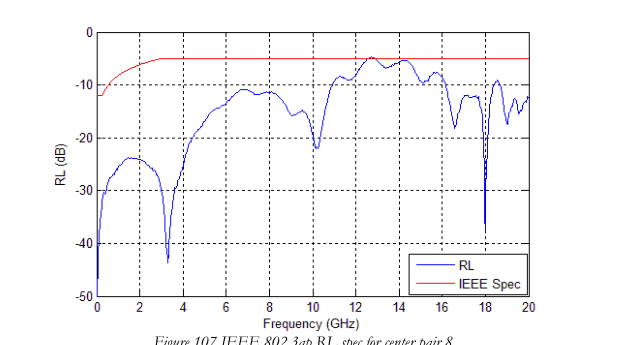
Figure 107 IEEE 802.3ap RL spec for center pair 8
5.2.2 Time-Domain NEXT and FEXT
Differential NEXT and FEXT were measured for 8 surrounding neighbors of the center differential pair (see Figure 100) and converted into time-domain data. Figure 108 and Figure 109 show the maximum differential NEXT and FEXT (in %) from each neighbor with step input at 60ps (20% to 80%) rise time with 5.25 GHz bandwidth. The center box corresponds to the absolute sum of NEXT and FEXT from all 8 surrounding pairs.
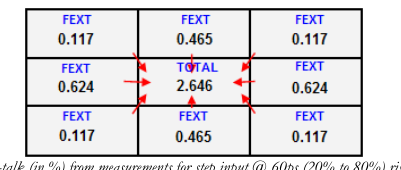
Figure 108 Differential cross-talk (in %) from measurements for step input @ 60ps (20% to 80%) rise time and 5.25GHz BW
for center pair 8 and 8 FEXT
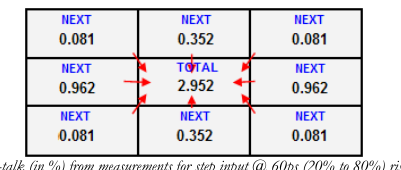
Figure 109 Differential cross-talk (in %) from measurements for step input @ 60ps (20% to 80%) rise time and 5.25GHz BW
for center pair 8 and 8 NEXT
Page 66
Page 66
Note: We measured crosstalk values of the inner wafer’s pairs with respect to the center pair and replicated them to the outer column 1.
5.2.3 Impedance profile
From the time domain results, the impedance profile is extracted and compared with simulation results, as shown in Figure 110.
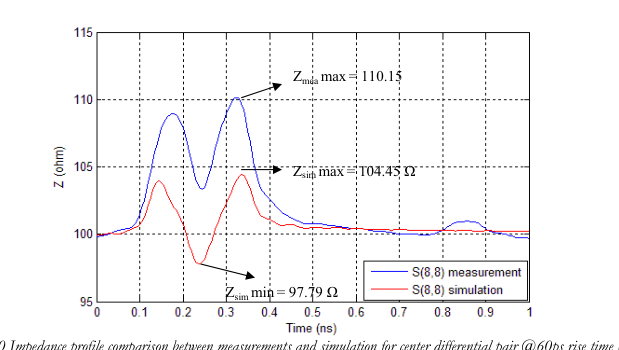
Figure 110 Impedance profile comparison between measurements and simulation for center differential pair @60ps rise time (20% to
80%) and 5.25GHz BW
5.3 Single-ended Signals
5.3.1 Measurement vs. Simulation Correlation (connector only)
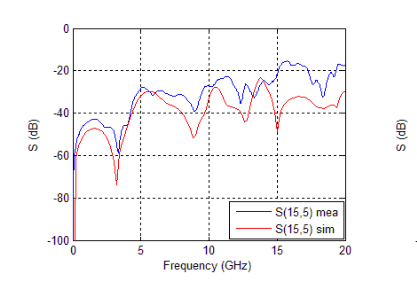
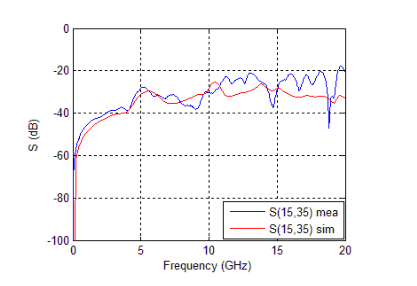
Figure 112 and Figure 113 show the measurement vs. simulation correlation of insertion loss (IL), return loss (RL) and single-ended S parameters (SDD for the center port 15 (as shown in Figure 111). Good correlation was observed for all IL, RL, near-end cross-talk (NEXT), and far-end cross-talk (FEXT).
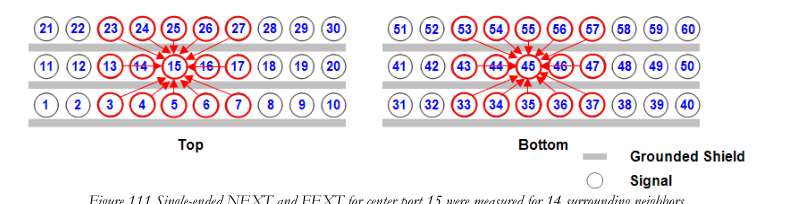
Figure 111 Single-ended NEXT and FEXT for center port 15 were measured for 14 surrounding neighbors
Page 67
Page 67
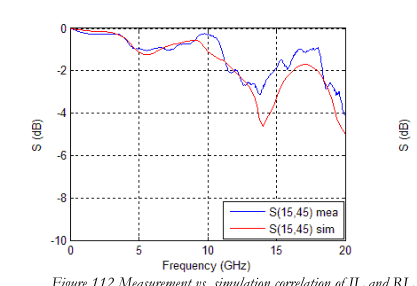
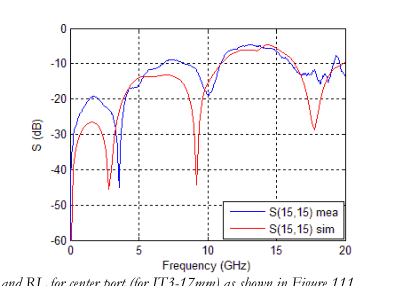
Figure 112 Measurement vs. simulation correlation of IL and RL for center port (for IT3-17mm) as shown in Figure 111
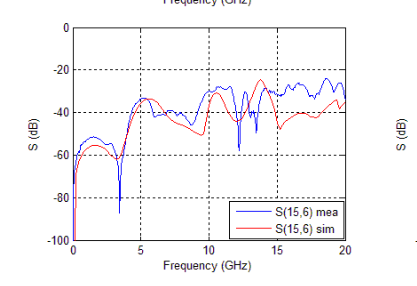
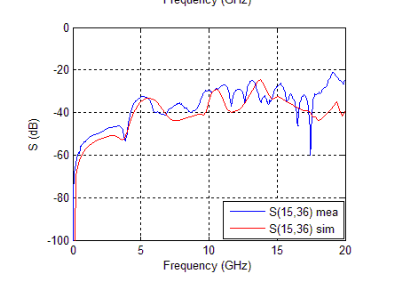
Page 68
Page 68
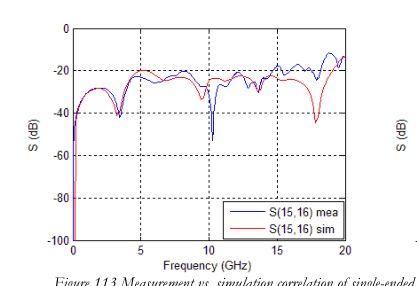
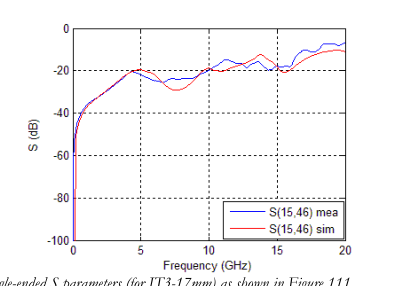
Figure 113 Measurement vs. simulation correlation of single-ended S parameters (for IT3-17mm) as shown in Figure 111
5.3.2 Time-Domain NEXT and FEXT
Single-ended NEXT and FEXT were measured for 14 surrounding neighbors of the center port (see Figure 111) and converted into time-domain data. Figure 114 and Figure 115 show the maximum single-ended NEXT and FEXT (in %) from each neighbor with step input at 120ps (20% to 80%) rise time with 2.625 GHz bandwidth. The center box corresponds to the absolute sum of NEXT and FEXT from all 14 surrounding ports.
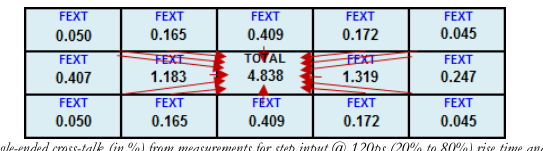
Figure 114 Single-ended cross-talk (in %) from measurements for step input @ 120ps (20% to 80%) rise time and 2.625GHz
BW for center port 15 and 14 FEXT
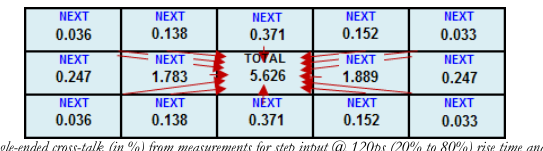
Figure 115 Single-ended cross-talk (in %) from measurements for step input @ 120ps (20% to 80%) rise time and 2.625GHz
BW for center port 15 and 14 NEXT
Note: We measured crosstalk values of the inner wafer’s pairs with respect to the center port and replicated them to the outer column 1.
Page 69
Page 69
5.3.3 Impedance profile
From the time domain results, the impedance profile is extracted and compared with simulation results, as shown in Figure 116.
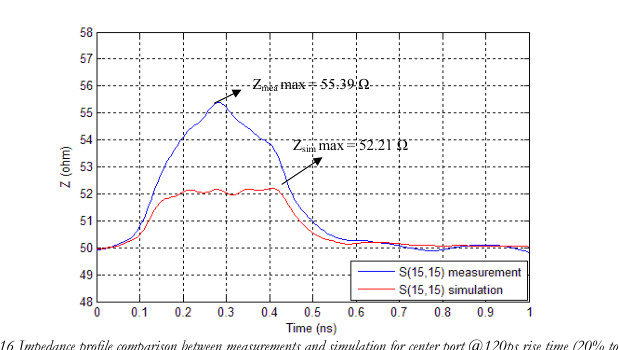
Figure 116 Impedance profile comparison between measurements and simulation for center port @120ps rise time (20% to 80%)
and 2.625GHz BW
Page 70
Page 70
6. Appendix
Figure 117 shows the ADS setup for channel simulations. For each data rate, 1,000 bits were simulated. Cross-talk values for each pair to the center pair were extracted and added to the final voltage seen at the receiver of the center pair. The rise and fall times used are given by:
× 40%
= BitTime
RiseTime 0%~100%
60%
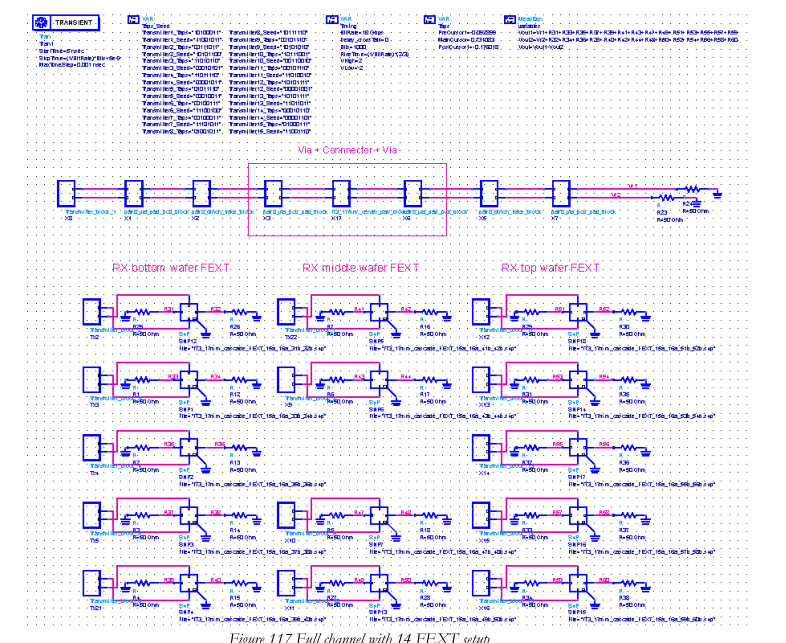
Figure 117 Full channel with 14 FEXT setup
Page 71
Page 71
Figure 118 shows the ADS schematic for the transmitter circuit with 3-tap de-emphasis setup. Each transmitter has a different bit pattern with a maximum register length of 32. The differential peakto-peak voltage at the output of the transmitter block is -1V to 1V.
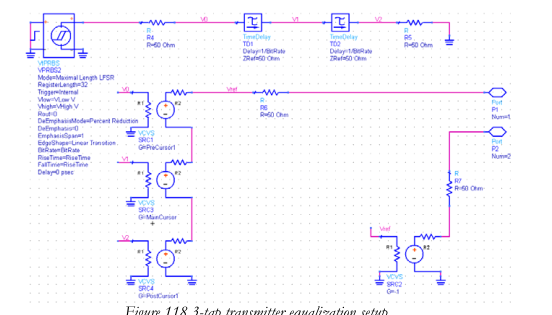
Figure 118 3-tap transmitter equalization setup